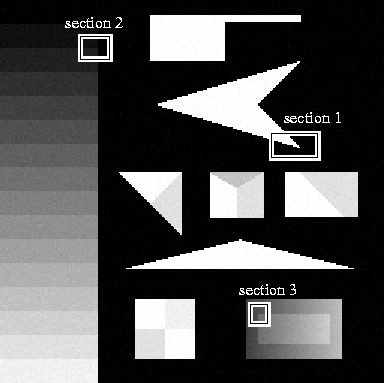
Figure 30: The noisy image used to test noise reduction filters with three particular sections of interest marked.
Some visual results of testing the SUSAN filter are now presented. Comparisons of the results are made with those obtained by using the other filters tested quantitatively.
The first results presented show the effect of attempting to reduce Gaussian noise added to the two dimensional test image introduced in Section 4.4. The noise was reduced by the filters from having a standard deviation of 3.0 to a standard deviation of 1.0. The noisy input image is shown in Figure 30. The outputs of the filters are shown in Figures 31--37. These figures are fairly self explanatory, with the weaknesses of the Gaussian, median and midrange filters clearly shown, and the good structure preserving qualities of the SUSAN filter evident. The GIW and SUSAN filters did not noticeably degrade the image structure when the standard deviation was reduced to 1.0, so they were re-applied. SUSAN was re-applied until the noise was barely noticeable, and GIW was re-applied until image degradation became apparent. In Figure 30 three sections of interest are marked; these areas of the image are shown as surfaces in Figures 38, 39 and 40, where the noisy input image and the outputs of the

Figure 30: The
noisy image used to test noise reduction filters with three particular
sections of interest marked.
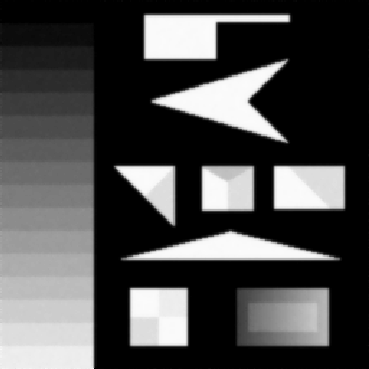
Figure 31: The result of applying Gaussian filtering with
 to the noisy image.
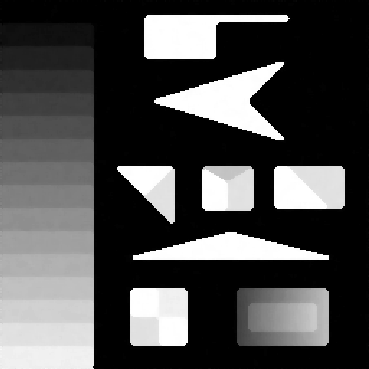
Figure 32: The result of applying median filtering to the noisy image.
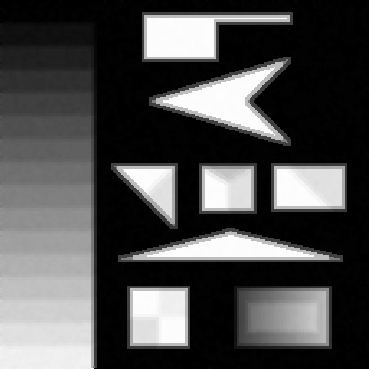
Figure 33: The result of applying midrange filtering to the noisy image.
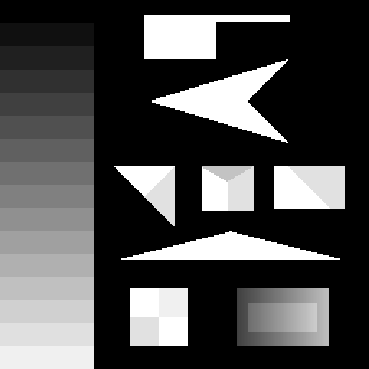
Figure 34: The result of applying GIW filtering to the noisy image.
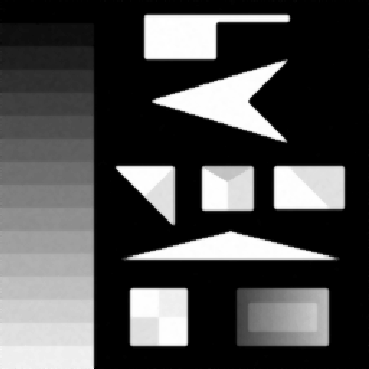
Figure 35: The result of applying K-nearest neighbour filtering to
the noisy image.
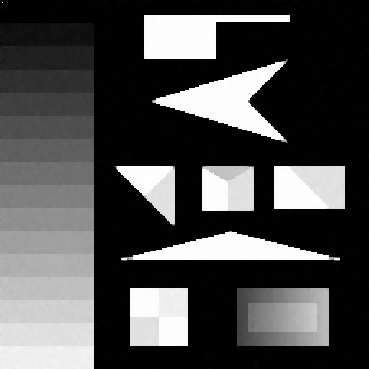
Figure 36: The result of applying SMCM filtering to the noisy image.
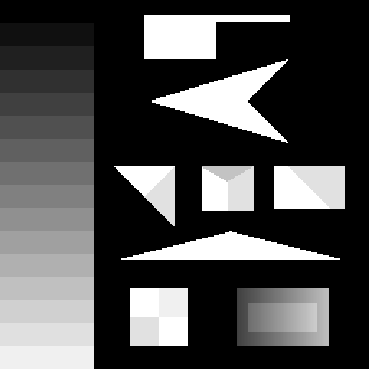
Figure 37: The result of applying SUSAN filtering to the noisy image.
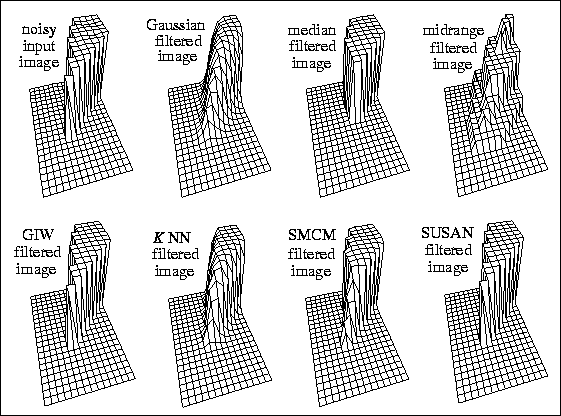
Figure 38: The outputs of the seven filters shown as
surfaces for section 1 of the input image.
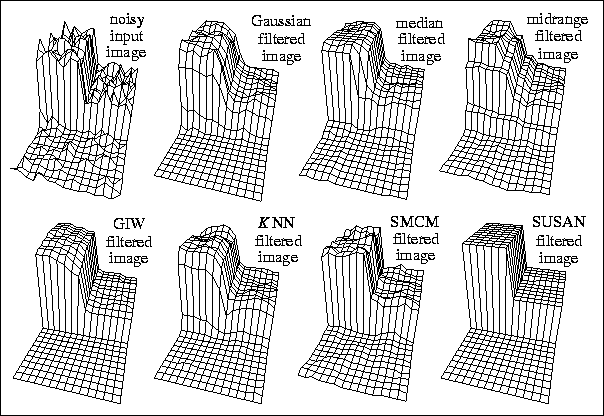
Figure 39: The outputs of the seven filters shown as
surfaces for section 2 of the input image.
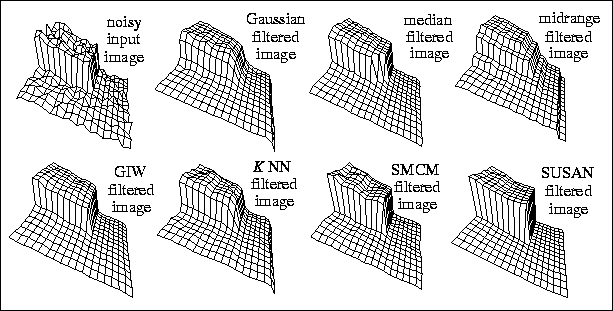
Figure 40: The outputs of the seven filters shown as
surfaces for section 3 of the input image.
the seven filters are plotted. The noise level visible in the input image surface appears to vary from figure to figure; this is because of variation in the contrast of the local image function. Figure 38 shows the end of a sharp corner of high contrast, Figure 39 shows a ``T-junction'' in the brightness function and Figure 40 shows a corner superimposed on a brightness ramp. The KNN and SMCM filters show noticeable image degradation for the given amount of noise reduction (see particularly Figure 38). The SUSAN filter is shown to have the best structure preserving qualities of the seven filters. In the case of the third section of interest, the SUSAN filter is shown to work correctly even when the regions making up the local image structure are far from horizontal, a difficult situation for many of the noise reducing filters based on strict image modelling. Note a small error in the estimation of the lower edge of the raised corner; at this edge the brightness curves slightly, rather than continuing in a tilted plane. This is due to the lack of lower neighbours to balance the upward pull of the higher neighbours; the pixels in the lower region are too low (as one would hope) to create this balance. Thus a ``second order'' inaccuracy in the surface estimation occurs.
Finally, in Figures 41 and 42, results are
shown of testing the seven filters on parts of more complicated
images. In example 1, part of the Mandelbrot set is degraded with
Gaussian noise of standard deviation 10.0. In example 2, a shield from
a photograph of a building is degraded with uniform noise of standard
deviation 10.0. In example 3, part of a real image of some printed
letters (shown in full, with edges superimposed, in
Figure 15) is degraded with ``salt and pepper'' noise, as
described earlier, with a ``corruption fraction'' of 0.05. The three
images were processed by Gaussian filtering (using  ),
median filtering (using a three by three mask to give the best image
preservation possible), midrange filtering, the GIW filter,
K-nearest neighbour filtering, the SMCM method (with k set to just
1 to give the least blurring possible) and the SUSAN filter. The input
images, the degraded images and the outputs of the filters are shown
in Figure 41 and 42. Again, the SUSAN filter
appears to give the best overall results.

Figure 41: Three example images,
each with a different type of added noise, processed by three
different filters.
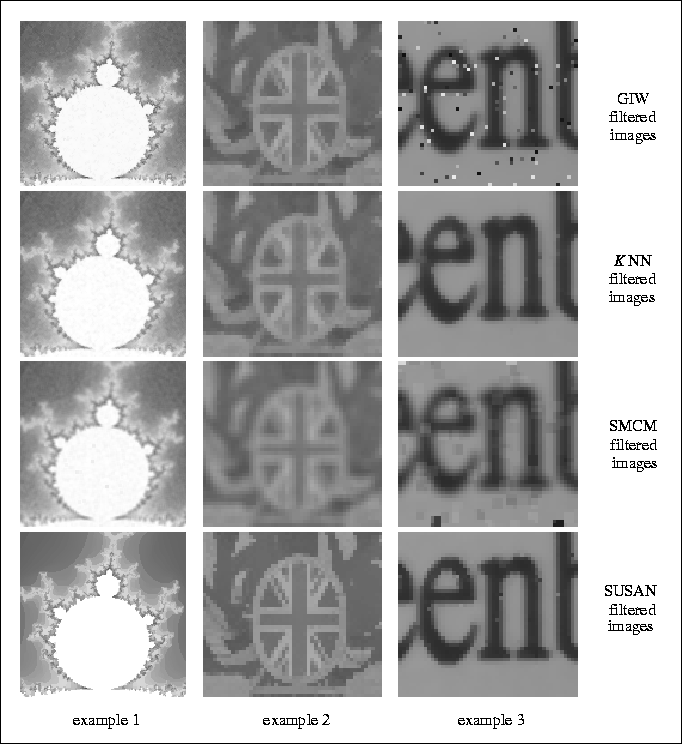
Figure 42: Three example images,
each with a different type of added noise, processed by four
different filters.