Two quantitative tests of the structure preserving qualities of seven noise reduction methods (including the SUSAN filter) are now presented. In the first test, noise was added to an image of a straight step edge, and each method was applied to give the same reduction in noise standard deviation. The amount which the edge was blurred was measured for each method. In the second test, noise was added to image corners, and again each method was applied to give the same reduction in noise standard deviation. The amount by which the corners (and their forming edges) were degraded was measured for each method. Both tests were performed with three different noise types at two different noise levels.
The Edge Test
The first test was performed on an image of an ideal step edge with
upper and lower brightness values of 150 and 100.![]() Noise was then added to the image and each noise filtering
method was applied to give a fixed reduction in the noise standard
deviation, so that the comparisons of edge degradation would be
performed after each method had smoothed the noisy image by the same
amount. The amount that the edge was blurred was quantified by
measuring the difference in brightness between neighbouring pixels
which were originally across the step edge; this difference was
averaged over 150 pixels along the middle of the edge. Therefore a
final ``edge height'' of 50.0 is a perfect score; the lower the
``height'', the more degraded the edge.
Noise was then added to the image and each noise filtering
method was applied to give a fixed reduction in the noise standard
deviation, so that the comparisons of edge degradation would be
performed after each method had smoothed the noisy image by the same
amount. The amount that the edge was blurred was quantified by
measuring the difference in brightness between neighbouring pixels
which were originally across the step edge; this difference was
averaged over 150 pixels along the middle of the edge. Therefore a
final ``edge height'' of 50.0 is a perfect score; the lower the
``height'', the more degraded the edge.
The Corner Test
The second test was performed on an image of 15 squares of size 17 by 17 pixels and brightness 150 on a background of brightness 100. Again noise was added to the image and each filtering method was applied to give a fixed reduction in the noise standard deviation. The degradation of the corners was quantified by taking the sum (over every pixel in all of the squares) of the absolute difference between the estimated brightness and the correct original brightness. Thus a ``corner error'' of zero is a perfect score; the higher the error, the more degraded the corners.
The Noise Types Added
The three noise types used to corrupt the images were additive Gaussian noise, additive uniform noise and impulse, or ``salt and pepper'' noise. The ``salt and pepper'' noise was created by choosing a fraction of the image to corrupt (at each pixel a random number in the range 0 to 1 was compared with this fraction to determine whether or not to corrupt the pixel) and then setting the pixels to be corrupted to random brightnesses in the range 0 to 255. Two noise levels were used for each noise type; a standard deviation of 15.0 (corresponding to an enormous amount of image noise, almost never found in ``real'' images) and a standard deviation of 2.5 (a standard deviation which is is still more than found in most ``real'' images). These standard deviations were reduced by the filters to standard deviations of 2.0 and 0.5 respectively, if possible. For each of the twelve combinations of original image, noise type and noise amount, only one image was generated, and used to test each of the filtering methods.
The Algorithms Tested
In [11] Chin and Yeh perform testing of the mean, K-nearest neighbour method, one of Lev's approaches (see [31]), the gradient inverse weighted method, selective neighbourhood weighting, Haralick's facet approach and median filtering. The scope of the testing was somewhat limited; no corner/junction degradation was investigated and only Gaussian noise was considered. The best ``all around results'' were those obtained by using the median and the K-nearest neighbour methods.
The noise reduction methods chosen for testing here were Gaussian
filtering (mainly for the sake of reference), median filtering,
midrange filtering, the gradient inverse weighted method (GIW), the
K-nearest neighbour method, the SMCM method and the SUSAN filter.
The Gaussian filter has variable  , so that only one iteration
is necessary to obtain the desired smoothing effect. The SUSAN filter
has variable
  (spatial smoothing) and also variable brightness
threshold, which is normally left at 12 greyscale values. The filter
can be iterated to achieve increased smoothing. The K-nearest
neighbour method has K set to 6, as this is the value found to be
optimal in [13]. It is iterated to increase smoothing. The
SMCM has a brightness parameter to set. As there is no mention in
[54] of the optimal value for this parameter k the
best value was chosen for each individual experiment. The method is
iterated to increase smoothing. The other three filters have fixed
mask sizes and are therefore iterated to achieve the desired smoothing
effects. Where consecutive iterations give output standard deviations
which lie either side of the target standard deviation, linear
interpolation was applied to find the structure degradation
measurement. In the case of the corner image corrupted with ``salt and
pepper noise'' the median filter achieved near zero output variance
after just one application, so a mask size of three by three pixels
was used as well as the default (five by five pixels) to reduce the
rounding of the corners, and so present the filter in the best
possible light.
Test Results
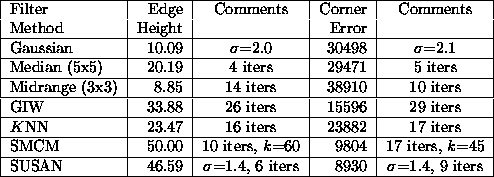
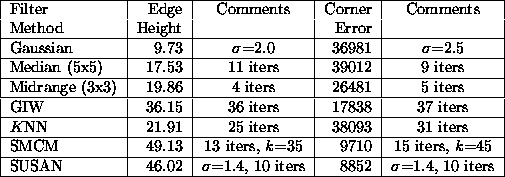
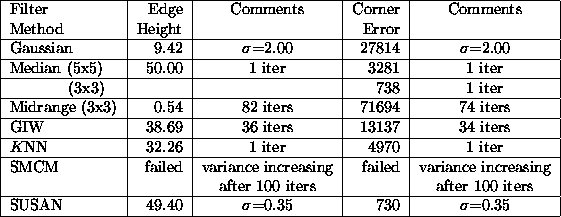
The results of the twelve individual tests are shown in Tables 1--6. These results clearly show the SUSAN filter to be the one which degrades image structure the least. The following points should be noted:

Table 1: The results of testing the noise
filters when Gaussian noise of standard deviation 2.5 is added.

Table 2: The results of testing the noise
filters when uniform noise of standard deviation 2.5 is added.

Table 3: The results of
testing the noise filters when ``salt and pepper'' noise of standard
deviation 2.5 is added.

Table 4: The results of testing the noise
filters when Gaussian noise of standard deviation 15.0 is added.

Table 5: The results of testing the noise
filters when uniform noise of standard deviation 15.0 is added.

Table 6: The results of testing the
noise filters when ``salt and pepper'' noise of standard deviation 15.0 is added.