A quantitative test of the initial response of the SUSAN detector compared with four other edge enhancement algorithms was described in Section 3. To give a more meaningful explanation of the tests described in [71] than the short one given earlier would require an undeserved amount of space. Suffice it to say that the initial response given by SUSAN was better than the best results of the four detectors used in these tests, using all six suggested ``failure measures''.
A one dimensional test of the SUSAN response to various edge types has been carried out using the input signal shown in Figure 9.
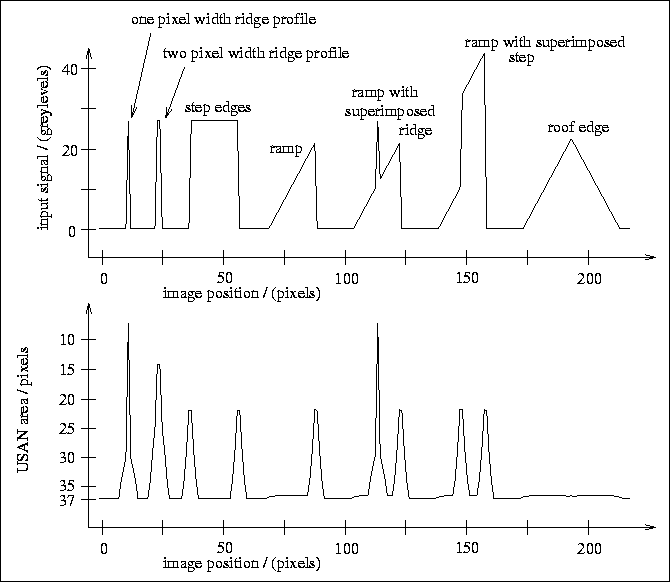
Figure 9: The initial response of the SUSAN edge finder to various edge
types.
The results are good. All the edge types are correctly reported apart from the roof edge. (Note that even the roof edge produces a very small local maximum in the response.) The ridge edges are picked up correctly, and produce only one response, as desired. Thus the SUSAN edge detector is shown to report lines correctly and not just edges. With the two pixel width ridge it is of course a matter of definition whether one ridge or two edges should be reported. The response is symmetrical about each edge type, which results in sub-pixel accuracy giving excellent results.
The roof edge obviously does not conform to the (fairly lenient) model of an edge which the SUSAN detector is based on. In [9] Canny states that
``A roof edge detector has not been incorporated into the implementation of the edge detector because it was found that ideal roof edges were relatively rare.''This is a common approach, and indeed, only second order derivative detectors (including Noble's edge detector, but not including second order zero-crossing detectors) will give a response to the roof edge. If edge finding is to be based on the human visual system, then roof edges (and step changes in the first derivative in general) should not be counted as edges at all anyway; humans can rarely detect this sort of image feature, and find it very hard to localize.
To test both edge detectors and two dimensional feature detectors a
test image which includes two dimensional structures of many different
types has been designed.![]() This
is shown in Figure 10.
This
is shown in Figure 10.
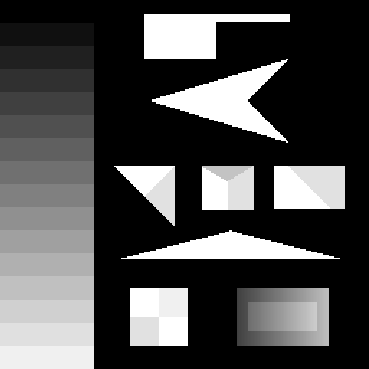
Figure 10: An image
designed to test corner and edge detectors.
Note the corners of widely varying angles, various junctions with more than two regions meeting at a point, and the region created by taking a brightness ramp and raising a rectangle in its centre by a uniform amount. An exact description of this test image can be found in [63].
Figure 11 shows the output of the SUSAN edge detector. Note that where a reported edge appears to jitter between one side of an image edge and the other, the effect is due simply to quantization of the marked edge position. In reality, giving the figure at a higher resolution (i.e. with sub-pixel accuracy) would show the edges to lie on the image edges. It can be seen from this diagram that the SUSAN edge detector possesses the following attributes:
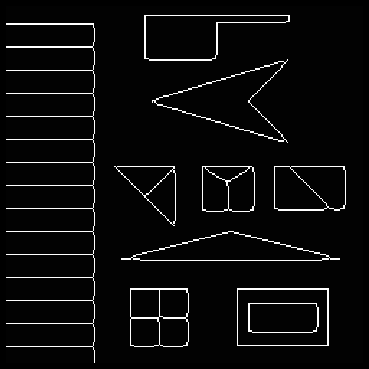
Figure 11: Output of the SUSAN edge finder (t=10) given the test
image.
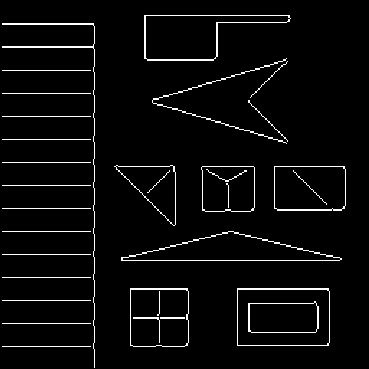
Figure 12: Output of the Canny edge finder ( =0.5) given the test
image.
=0.5) given the test
image.
interest:
 is needed,
usually at least
is needed,
usually at least  . This results in even greater breaks at
junctions, and incorrectly rounded corners.
. This results in even greater breaks at
junctions, and incorrectly rounded corners.
Figure 13 shows the output of the SUSAN edge
finder when Gaussian noise is added to the test image. The noise added
gives a minimum signal to noise ratio![]() of 5. This amount
of noise is greater than would be expected in a normal real image by a
factor of about 3. The results are good. A lot of the noise in the
reported edges is only apparent, as the noise simply forces the edge
to toggle between lying on one side of the real edge or the other,
with no loss of accuracy. Continuity is still preserved, in even the
sharpest angles (note, of course, that pixels touching diagonally
constitute continuity). The output of the Canny edge finder degrades
slightly more than the output of the SUSAN algorithm; see
Figure 14.
of 5. This amount
of noise is greater than would be expected in a normal real image by a
factor of about 3. The results are good. A lot of the noise in the
reported edges is only apparent, as the noise simply forces the edge
to toggle between lying on one side of the real edge or the other,
with no loss of accuracy. Continuity is still preserved, in even the
sharpest angles (note, of course, that pixels touching diagonally
constitute continuity). The output of the Canny edge finder degrades
slightly more than the output of the SUSAN algorithm; see
Figure 14.
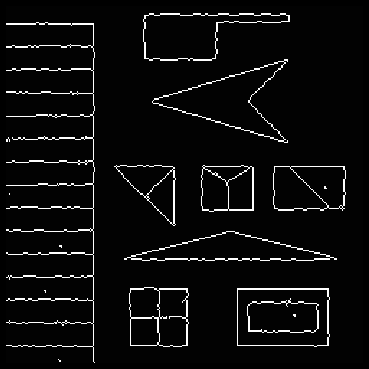
Figure 13: Output of the SUSAN edge finder (t=10) given a test image
with Gaussian noise of minimum SNR=5 added.
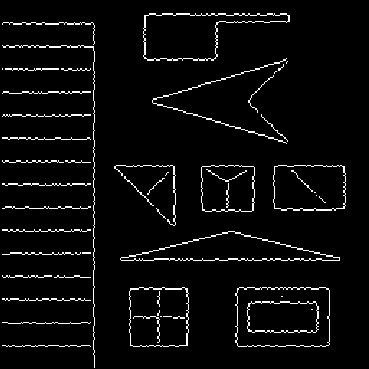
Figure 14: Output of the Canny edge finder ( =0.5) given
the test image with Gaussian noise of minimum SNR=5 added.
=0.5) given
the test image with Gaussian noise of minimum SNR=5 added.
Figures 15 and 16 show the result of running
the SUSAN edge finder on a digitized real image of some printed text.
Note that edges (here and in some of the other examples) have been
marked in white with a black border so that all the marked edges are
visible. The small (three by three) mask has been used for the SUSAN
edge detector, and Canny has been carefully optimized to give the best
possible results, by choosing a small value for  and the best
response threshold. Note that not only does the Canny detector have
broken edges at several places, but the boundaries of the dots
comprising the colon are not very clean circles. The original dots'
boundaries are fairly good circles, and are better represented
by the output of the SUSAN edge finder. This suggests that the SUSAN
edge detector is more isotropic than a derivative based detector, as
one would expect.
and the best
response threshold. Note that not only does the Canny detector have
broken edges at several places, but the boundaries of the dots
comprising the colon are not very clean circles. The original dots'
boundaries are fairly good circles, and are better represented
by the output of the SUSAN edge finder. This suggests that the SUSAN
edge detector is more isotropic than a derivative based detector, as
one would expect.

Figure 15: Output of the SUSAN edge finder (t=20, 3 by 3
mask) given the ``letters'' image.
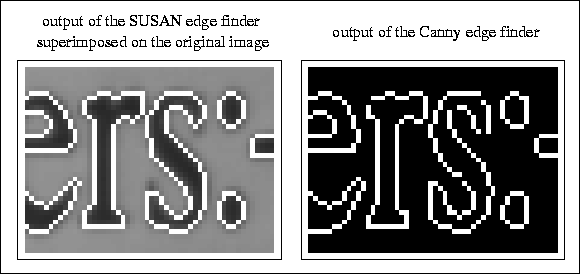
Figure 16: Small sections of the outputs of the SUSAN (t=20, 3 by 3
mask) and Canny ( =0.5) edge finders when given the ``letters''
image.
=0.5) edge finders when given the ``letters''
image.
Two more real examples of testing the SUSAN edge detector are given in Figures 17 and 18. Figure 17 is taken from the testing of the motion segmentation and tracking system ASSET (see [65]), where the SUSAN edge detector is used to fine-tune motion segmentation boundaries, enhancing the final accuracy. In Figure 18 note that junctions are correctly handled. In both pictures very slight breaks in the reported edges appear due to the dithering process used by the printer.
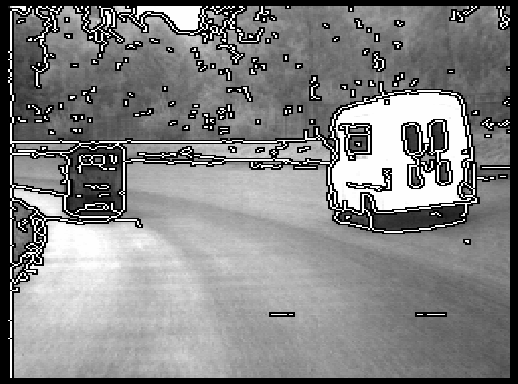
Figure 17: Output of the SUSAN edge finder (t=25) given the road image.
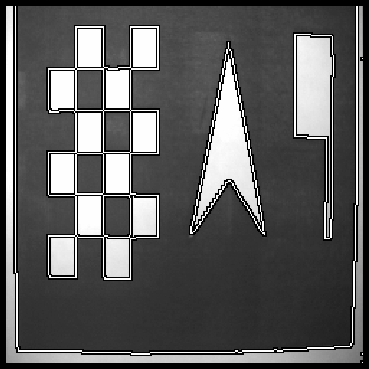
Figure 18: Output of the SUSAN edge finder (t=20) given a real test
image. The image was created by laser printing a synthetic test image
and then digitizing it using a video camera.
The results of the tests described show the SUSAN edge detector to be accurate, stable and very fast on both test and real images. It has given very good results in all the tests.
Finally, the idempotence of the SUSAN principle is investigated. It has been suggested (e.g., see [70]) that feature enhancement should be idempotent. This means that after one application of the enhancement process, further applications should make no change to the processed image. The supposed desirability of this property is based on three notions:
Investigation of idempotence can be applied at two very different levels for feature detectors. Repeating the initial enhancement on itself is one level, that is, only using the first stage of a feature detector (for example, Sobel enhancement). Taking the final output of the complete algorithm (including non-maximum suppression and thinning if appropriate) and feeding this back into the complete algorithm is the other level (for example, the Canny edge detector).
In the testing performed the test image was fed into an edge enhancement algorithm, this output was fed back into the algorithm, and the output of this was fed back in once more. Thus each algorithm was run a total of three times. For each algorithm the outputs after one pass and after three passes were examined. Due to lack of space the visual results must be seen in [63]. The results show that the initial response of the SUSAN enhancement gives maximal ridges (which would usually be suppressed to be one pixel thick) which are still evident, and no double edges have been produced. In contrast, a 3 by 3 Sobel operator produces multiple responses at nearly all of the edges.
Testing the complete SUSAN algorithm shows that after three
passes the results are virtually unchanged from the initial thinned
edge map.![]() In contrast,
the Canny algorithm produces multiple responses at nearly all of the
edges.
In contrast,
the Canny algorithm produces multiple responses at nearly all of the
edges.
The results show that, as would be expected from the nature of SUSAN feature enhancement, the SUSAN edge detector is idempotent.