2.3 Magnetic Resonance Imaging
2.3.1 Magnetic Field Gradients
As has been shown in
Section 2.2, the fundamental equation of magnetic resonance is the
Larmor equation,  . In an
NMR experiment a measurement of the frequency of precession of the
magnetisation gives information on the field experienced by that group
of spins. By manipulating the spatial variation of the field in a
known way, this frequency information now yields spatial
information.
Consider a linear field gradient in B
which increases along the x axis, such that

(2.36)
where G is the
gradient strength. This makes the Larmor equation

(2.37)
or in its more general three dimensional form

(2.38)
Under
a linear field gradient along the x axis, all the spins which lie at a
particular value of x will precess at the same frequency. The FID
from such a sample will contain components from each of the x values
represented by the sample, and the frequency spectrum will therefore
represent the number of spins that lie along that plane

(2.39)
as shown in Figure 2.7c.
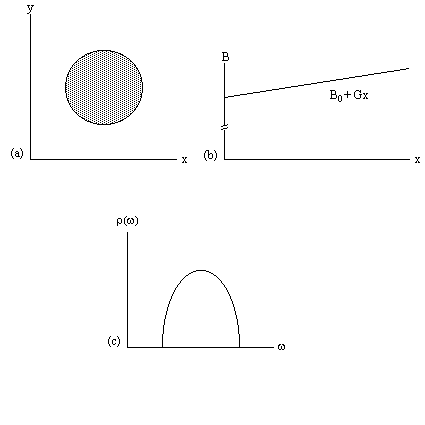
Figure 2.7. (a) A cylindrical object aligned along the z-axis.
(b) Linear field gradient applied along the x-axis.
(c) Plot of the number of spins at frequency w
This simple spectrum therefore gives the spatial
information about the object being imaged along one dimension. To
build up the complete 3D image it is necessary to apply time varying
field gradients. A number of methods for doing this are described
later in this section, but first the notion of k-space is introduced,
which is useful in describing all these techniques.
2.3.2 Reciprocal (k) space
Having denoted the number
of spins at a particular location r, as the spin density,
r(r), the
signal from the sample can be written

(2.40)
The reciprocal space vector is defined

(2.41)
and the Fourier relationship between signal and spin
density becomes obvious

(2.41)
Thus k is the conjugate variable for r. The
resolution of the image depends on the extent of k-space that is
sampled, and it is by looking at how different imaging techniques
cover k-space that they can usefully be compared
[8]. For example in the
previous section a gradient along the x-axis was applied to a
cylindrical sample. This meant that values in kx could be
sampled, but not in ky
and so the complete 2D structure could not be obtained.
There are imaging techniques which sample all three dimensions
of k space, but most techniques reduce the problem to two dimensions
by applying slice selection.
2.3.3 Slice Selection
Slice selection is a technique to isolate a
single plane in the object being imaged, by only exciting the spins in
that plane. To do this an r.f. pulse which only affects a limited
part of the NMR spectrum is applied, in the presence of a linear field
gradient along the direction along which the slice is to be selected
(Figure 2.8). This results in the excitation of only those spins
whose Larmor frequency, which is dictated by their position, is the
same as the frequency of the applied r.f. pulse.
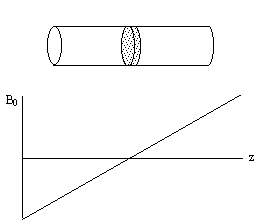
Figure 2.8. A long cylindrical object aligned along the
z-axis in a field gradient which increases linearly with increasing z.
Consider an r.f. pulse of duration 2t
which is applied in the
presence of a gradient along some axis, say z, such that
2tgB1=
p/2 (a 90 degree pulse).
The spins where B=B0
(i.e. z=0) will precess into the transverse plane,
whilst those where B>>B0 (i.e. z>>0) will precess
about Beff=Dw/g
k+B1i, and have little effect on the transverse
magnetisation (Figure 2.9).
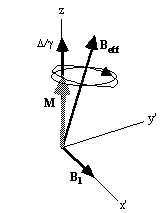
Figure 2.9. Effect of a 90 degree pulse on (a) off-resonant
spins and (b) near-resonant spins.
To tailor the
shape of slice selected it is necessary to modulate the pulse profile.
For small flip angles the relationship between the pulse modulation
and slice profile can be derived. To do this consider applying an
r.f. pulse lasting from t=-T to +T, to a sample in a gradient
Gz. The
Bloch equations as shown earlier (equation. 2.29) in the rotating
frame, neglecting T1 and T2 relaxation,
become
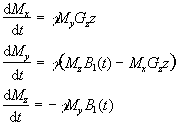
(2.43)
Now these are transformed to another frame of reference
which rotates at angular frequency gGzz. Each slice will have a different
reference frame, depending on the value of z, but considering just one
of these gives
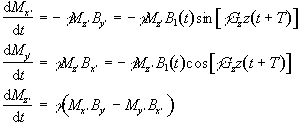
(2.44)
with the two
reference frames coinciding at t=-T. If the assumption is made that
the flip angles are small then it is possible to say that
Mz'
varies very little, and takes the value M0.
So equations 2.44 become
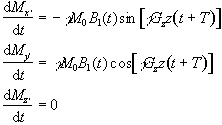
(2.45)
If Mx and My are treated as real
and imaginary parts of the complex magnetisation  , the equation of motion becomes

(2.46)
By integrating and converting back to the original (rotating) frame
of reference, since

gives

(2.47)
This is the Fourier transform
of the r.f. pulse profile, so a long pulse gives a narrow slice and
vice-versa. This equation also shows one other thing about the
magnetisation in the slice after the pulse. There is a phase shift
through the slice of gGzzT
which will cause problems for imaging later. This
can be removed by reversing the gradient Gz for a duration T,
which is known as slice refocusing.
To excite a sharp edged slice, the
r.f. pulse modulation required is a sinc function. For practical
implementation of this kind of pulse it is necessary to limit the
length of the pulse, and so usually a five lobe sinc function is used.
The above approximation is only correct for small pulse angles. For
larger flip angles, it is hard to analytically determine the pulse
modulation required for a desired slice profile, and so it is usually
necessary to use some form of iterative method to optimise pulses
[9].
Using such techniques it is possible to design a range of pulses which
are able to select different slice profiles and carry out other spin
manipulation techniques such as fat or water suppression. It is also
possible to design pulses which do not require refocusing
[10]. Usually
the limit in such novel designs is their practical implementation, and
so the most common three pulse modulations used are a 'hard' pulse,
with top-hat modulation, a Gaussian modulation or a 'soft' pulse, with
truncated sinc modulation.
If any slice other than the central (B=B0)
slice is required, then the frequency of oscillation
can be altered and the slice selected will be at the position along
the z-axis given by

(2.48)
2.3.4 Early MR Imaging Techniques
The extensively
used techniques in MRI are all Fourier based, that is the 'spin-warp'
technique and Echo Planar Imaging (EPI)
[11].
However the early MR images
used point and line methods and these are described here, along with
the technique of projection reconstruction.
The f.o.n.a.r. technique (field focused nuclear
magnetic resonance) was proposed by Damadian, and was
used to produce the first whole body image in 1977
[12]. The basis of the
technique is to create a shaped B0 field which has a central
homogeneous region, surrounded by a largely inhomogeneous region. The
signals from the inhomogeneous regions will have a very short
T2* and can thus be distinguished from
the signal from the homogeneous region. By scanning the homogeneous
field region across the whole of the sample an image can be made up.
This is a time consuming procedure taking tens of minutes for a single
slice. The two advantages of the technique are its conceptual
simplicity and the lack of a requirement for the static field to be
homogeneous over a large area. Shaped r.f. pulses can also be used to
isolate a small region, and such methods form the basis of localised
spectroscopy.
As was shown in section 2.3.1, if we have
only a one dimensional object then a single linear gradient is
sufficient to locate position directly from the FID by Fourier
transformation. If then the three dimensional sample can be reduced
to a set of one dimensional components then the whole sample can be
imaged. This can be done by selective irradiation, or slice
selection, in two of the dimensions. First, in the presence of a
gradient along the z-axis, a selective pulse is applied which
saturates all the spins outside the plane of interest (Figure 2.10a).
Then a gradient is applied along the x-axis, and those spins not
saturated are tipped into the transverse plane by a selective 90 degree
pulse (Figure 2.10b). Immediately after the second r.f pulse the only
region with any coherent transverse magnetisation is the line of
intersection of the two selected planes. A gradient is now applied
along the y-axis, and the evolution of the FID recorded. Fourier
transform of the FID gives the proton densities along that line. By
repeating the line selection for all the lines in the plane, an image
of the whole of the plane can be built up. There are many variations
of the line scan technique, some of which utilise 180 degree pulses,
but they are inefficient in comparison to the Fourier methods
discussed in the next section.
(a) 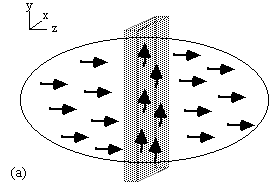 (b)
(b) 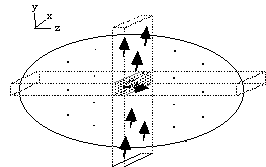
Figure 2.10. Line selection using two rf pulses. (a) In the
presence of a gradient along the z-axis, all spins outside the shaded
plane are saturated. (b) In the presence of a gradient along the x-axis
those spins not saturated in the selected horizontal plane are tipped
into the transverse plane and can be observed in the presence of a
gradient along the y-axis
One final method
of interest is projection reconstruction. This is the method used to
build up X-ray CT scans [13],
and was the method used to acquire the early
MR images. Following slice selection, a gradient is applied along the
x-axis and the projections of the spin densities onto that axis
obtained by Fourier transformation of the FID. Then a linear gradient
is applied along an axis at some angle to the x-axis,
q. This can be achieved by
using a combination of the x and y gradients
 .
.
(2.49)
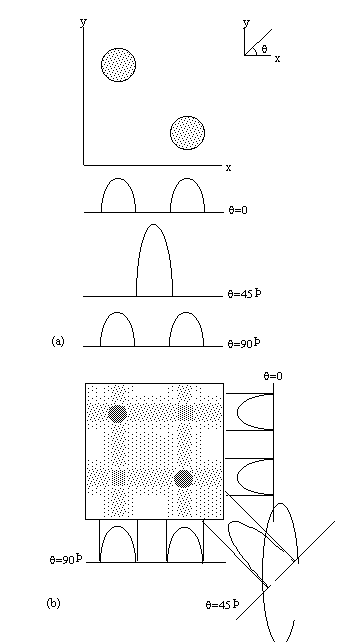
Figure 2.11. The technique of Projection
Reconstruction. (a) Two cylindrical objects are placed in the x-y
plane and their projection onto three axes, angled at 0,
45 and 90 degrees to the x-axis are recorded, (b) By back
projecting the projections, the location of the objects can be
ascertained.
Projections are taken
as q is
incremented up to 180 degrees (Figure 2.11a). The set of projections
can then be put together using back projection. This distributes the
measured spin densities evenly along the line normal to the axis it
was acquired on. By reconstructing all the angled projections the
image appears. There is however a blurred artefact across the whole
image, where an attempt was made to assign spin density to areas where
there is in fact none, and star artefacts where a finite number of
projections have been used to define point structures. This can be
corrected using a technique called filtered back projection, which
convolves each of the profiles with a filter

(2.50)
This is done in
the Fourier domain by dividing the Fourier projections by the modulus
of the vector k as defined in section 2.3.2.
Projection reconstruction has been largely superseded by
methods which sample k-space more uniformly.
2.3.5 Fourier and Echo Planar Imaging
Quadrature
detection of the FID means that the phase as well as the frequency of
the signal can be recorded. This is utilised in the Fourier
techniques described in this section.
The 'spin-warp'
method (often called 2DFT) as described by Edelstein et. al.
[14] is
a development of the earlier technique of Fourier zeugmatography
proposed by Kumar, Welti, and Ernst [15].
The Fourier zeugmatography
sequence can be split into three distinct sections, namely slice
selection, phase encoding, and readout. The pulse sequence diagram
for the sequence is shown in Figure 2.12. Such diagrams are commonly
used to describe the implementation of a particular MR sequence, and
show the waveform of the signal sent to the three orthogonal gradient
coils and the r.f. coil.
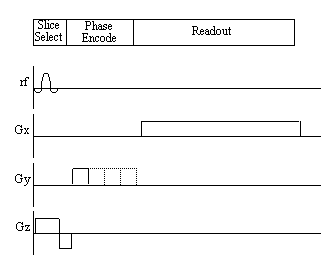
Figure 2.12. Pulse sequence diagram for the Fourier
zeugmatography imaging technique.
Having excited
only those spins which lie in one plane, a gradient is applied along
the y-axis. This will cause the spins to precess at a frequency
determined by their y position, and is called phase encoding. Next a
gradient is applied along the x-axis and the FID is collected. The
frequency components of the FID give information of the x-position and
the phase values give information of the y-position.
More
specifically, if a gradient of strength Gy is applied for
a time ty during the phase
encoding stage, and then a gradient Gx is applied for a duration
tx the
signal recorded in the FID is given by

(2.51)
By writing  equation (2.51) becomes

(2.52)
so the single step is
equivalent to sampling one line in the kx direction of k-space.
To cover the
whole of k-space it is necessary to repeat the sequence with slightly
longer periods of phase encoding each time (Figure 2.13).
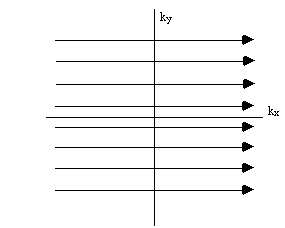
Figure 2.13. K-space sampling with Fourier zeugmatography
Having acquired data for all values of kx and ky,
a 2D Fourier transform recovers the spin density function

(2.53)
Figure 2.14 illustrates how
the magnetisation evolves under these two gradients.
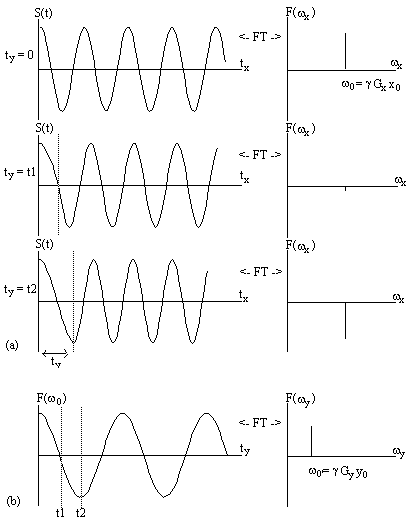
Figure 2.14. Two dimensional Fourier image
reconstruction following Fourier zeugmatography. (a) A single
magnetisation vector at position (x0, y0),
is allowed to evolve under
a gradient along the y axis for a time ty, before being
observed under
an x gradient. The real components of the Fourier transform of the
FID's are shown, giving the x position. (b) Having acquired FID's for
all values of ty, a Fourier transform along the second dimension
gives the y position.
One drawback of this technique is that the time between exciting the
spins, and recording the FID varies throughout the experiment. This
means that the different lines in the ky direction will
have different
weighting from T2* magnetisation decay.
This is overcome in spin-warp imaging by keeping the length of the y
gradient constant for each acquisition, and varying ky by
changing the gradient strength. The pulse diagram for this technique
is shown in Figure 2.15.
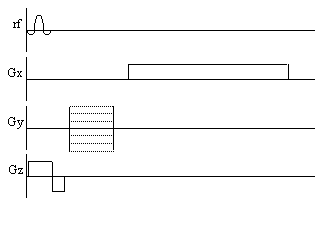
Figure 2.15. Pulse sequence diagram for the spin-warp technique.
Phase encoding is performed by varying the magnitude of the y gradient.
It
is desirable to have as much signal as possible for each FID, and a
necessity that the amount of transverse magnetisation available
immediately after the r.f. pulse is the same for each line. This can
be a problem since the recovery of longitudinal magnetisation is
dependent on spin-lattice relaxation, and T1 values in
biomedical imaging are of
the order of seconds. Keeping the time between adjacent spin
excitations, often known as TR, the same throughout the image
acquisition will keep the transverse magnetisation the same for each
FID, provided the first few samples are discarded to allow the system
to come to a steady state. Leaving the magnetisation to recover
fully, however, would be very costly in time, so it is usually
necessary to have a TR which is less than T1. To maximise
the signal received for small TR values it is possible to use a smaller
flip angle than 90 degrees. The transverse magnetisation that is
available after such a
pulse is less than it would be after a 90 degree pulse, but there is
more longitudinal magnetisation available prior to the pulse. To
optimise the flip angle q, for a particular
TR, we first assume that the steady
state has been reached, that is that

(2.54)
Now the magnetisation is
flipped by a q degree pulse, and the
z-magnetisation becomes
 .
.
(2.55)
The recovery of the magnetisation is governed by the equation

(2.56)
which can be integrated to find M',

(2.57)
The transverse magnetisation following the pulse, which we want to
maximise, is given by

(2.58)
which has its maximum value when

(2.59)
The angle this occurs at is known as the Ernst angle
[16]. The amount of signal available is
very dependent on the repetition time TR. For example, if a sample has a
T1 of 1s,
then at a TR of 4s M'=0.98M0, however as TR is reduced to 500ms,
M'=0.62M0.
If a 3D volume is to be imaged then it is
possible to acquire extra slices with no time penalty. This is
because it is possible to excite a separate slice, and acquire one
line of k-space, whilst waiting for the longitudinal magnetisation of
the previous slice to recover. This technique is called
multi-slicing.
The common implementation of the spin-warp
technique, FLASH (Fast Low-Angle SHot imaging)
[17], uses very small flip
angles (~5 degrees) to run at with a fast repetition rate, acquiring an
entire image in the order of seconds.
In Echo Planar Imaging [18,
19] (EPI) the whole of k-space is
acquired from one FID. This is possible because, having acquired one
set of frequency information, the sign of the readout gradients can be
reversed and the spins will precess in the opposite direction in the
rotating frame (Figure 2.16) and subsequently rephase causing a
regrowth of the NMR signal. This is a called a gradient echo. By
switching the readout gradient rapidly, the whole of k-space can be
sampled before spin-spin (T2) relaxation attenuates the
transverse magnetisation. Phase encoding is again used in order to
sample ky.
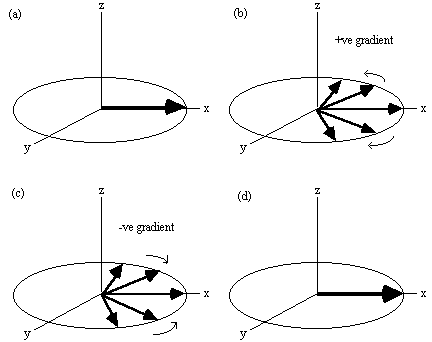
Figure 2.16. Evolution of the magnetisation vector in the
rotating frame, under a gradient echo (assuming no T2
relaxation). (a) Immediately after a 90 degree pulse all the spins are
in phase. (b) A gradient will increase the precession frequency of some
spins and reduce that of others. (c) Reversal of the gradient at time
T causes the spins to refocus, (d) coming back to their initial state at
time 2T.
The pulse sequence diagrams and k-space trajectories for EPI are shown
in Figure 2.17.
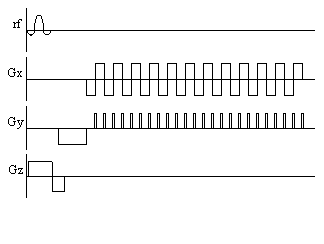
Figure 2.17. (a) Pulse sequence diagram and (b) k-space
sampling pattern for echo planar imaging
The three gradients in EPI
are usually labelled the slice select (z), blipped (y) and switched
(x), because of their respective waveforms. Echo planar imaging is a
technically demanding form of MRI, usually requiring specialised
hardware, however it has the advantage of being a very rapid imaging
technique, capable of capturing moving organs like the heart, and
dynamically imaging brain activation. This is only a brief
introduction to EPI, since its strengths and limitations are discussed
in more detail in the following chapters.
2.3.6 Other Imaging Sequences
There are numerous
variations on the basic MRI sequences described above. Several of
them, notably interleaved EPI, are explained in other chapters. Other
important sequences are outlined here.
It was shown in the
previous section how phase encoding enabled the information on the
second dimension to be added to the one dimensional line profile. It
is possible to extrapolate this procedure to the third dimension by
introducing phase encoding along the z axis. Thus the 2D-FT technique
is extended to a 3D-FT technique [20].
All such volumar imaging sequences
first involve the selection of a thick slice, or slab. Then phase
encoding is applied in the z-direction and the y-direction, followed
by a readout gradient in the x-direction, during which the FID is
sampled. The assembled FID's are then subject to a three
dimensional Fourier transform yielding the volume image. Phase
encoding can also be used in EPI instead of multi-slicing. The slice
select gradient and r.f. pulse being replaced by a slab selective
pulse and a phase encoding gradient along the z-axis.
Going even further, it is possible to acquire all the
data to reconstruct a 3D volume from one FID, in the technique called
Echo Volumar Imaging (EVI) [21].
This uses another blipped gradient in the
z direction, as shown in Figure 2.18. The limitation in EVI is the
need to switch the gradients fast enough to acquire all the data,
before T2* destroys the signal.
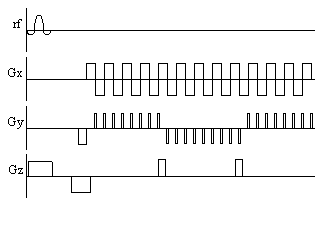
Figure 2.18. Pulse sequence diagram for Echo Volumar Imaging
Often the main limitation in implementing fast imaging
sequences such as EPI is switching the gradients at the fast rates
required. A sequence which is similar to EPI, but slightly easier to
implement is spiral imaging. This covers k-space in a spiral from the
centre outwards, which requires sinusoidal gradients in x and y,
increasing in amplitude with time. Such gradient waveforms are easier
to produce than the gradients required for EPI. Spiral imaging also
has the advantage of sampling the centre of k-space first, and so the
low spatial frequencies, that affect the image the most are sampled
first, when the signal has not been eroded by T2*.
The pulse sequence diagram and coverage of k-space for
spiral imaging are shown in Figure 2.19.
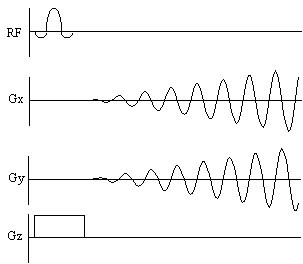
Figure 2.19 Pulse sequence diagram and k-space sampling diagram
for spiral imaging
In
general imaging, the chemical shifts of the protons are ignored, and
usually seen only as an artefact. However it is possible to image the
chemical shifts, which gives not only spatial information but also
spectral information. The technique, called Chemical Shift Imaging
(CSI) [22],
treats the chemical shift as an extra imaging gradient in the
fourth dimension. By introducing a variable delay between the
excitation pulse and imaging gradients, the chemical shift
'gradient' will phase encode in this direction. Fourier
transformation in this case gives the conventional NMR spectrum.
Finally, it is possible to image nuclei other than the proton.
Sodium, phosphorus and carbon-13 have all been used to form biomedical
images. In the case of 13C, its low natural abundance makes
it useful for tracer studies.
Previous Section |
Contents |
Next Section
 . In an
NMR experiment a measurement of the frequency of precession of the
magnetisation gives information on the field experienced by that group
of spins. By manipulating the spatial variation of the field in a
known way, this frequency information now yields spatial
information.


 , the equation of motion becomes


 (b)
(b) 
 .
.


 equation (2.51) becomes


 .
.


