(a) 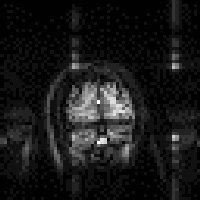 (b)
(b) 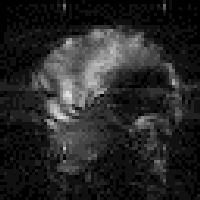
(c) 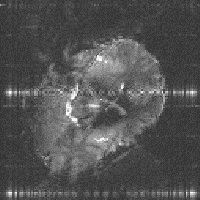 (d)
(d) 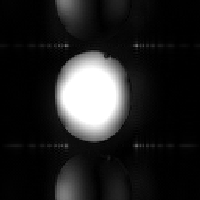
(e) 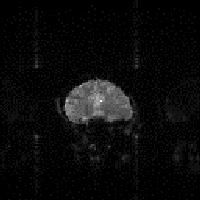 (f)
(f) 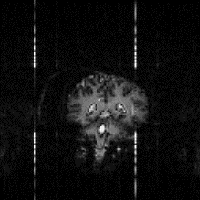
As with any imaging modality, magnetic resonance images suffer from a number of artefacts. In this section, a number of the common artefacts are described, together with ways by which they can be reduced.
(a)  (b)
(b) 
(c)  (d)
(d) 
(e)  (f)
(f) 
The basic assumption of MRI is that the frequency of precession of a spin is only dependent on the magnitude of the applied magnetic field gradient at that point. There are a two reasons why this may not be true.
Firstly, there is the chemical shift. This has the effect of shifting the apparent position in the image of one set of spins relative to another, even if they originate from the same part of the sample. The chemical shift artefact is commonly noticed where fat and other tissues border, as in the image of a brain in Figure 2.29a, where the fat around the skull forms a shifted 'halo'. The artefact can be removed by spin suppression, such that a selective pulse excites only the protons in the fat [26]. When the image excitation pulse is subsequently applied, the fat spins are already saturated, and so do not contribute to the image.
Secondly, the static magnetic field (B0) may not be perfectly homogeneous. Even if the magnet is very well built, the differences in magnetic susceptibility between bone, tissue and air in the body, means that the local field is unlikely to be homogeneous. If the susceptibility differences are large, such that the local magnetic field across one voxel varies by a large amount, then the value of T2* is short and there is little or no signal from such voxels. This effect is particularly evident if any metal object is present as shown in Figure 2.29b. If the differences are smaller, and the field is affected over a few voxels, then the effect is a smearing out of the image, as shown in Figure 2.29c as the altered field is interpreted as a difference in position. In 2DFT techniques susceptibility distortions occur in the readout direction, whereas in EPI they occur in the phase encoding, that is blipped, direction. The reason for this is because these are the directions in which the frequency separation of pixels is smallest. In EPI this separation can be very small so that even a small change in precessional frequency may be detected.
To reduce the artefact it is possible to locally correct the field using a set of shim coils. These apply shaped fields across the sample and in combination increase homogeneity. Susceptibility artefact is more apparent in the rapid imaging methods such as EPI and FLASH, and is difficult to reduce without losing the fast imaging rates. One way to reduce the distortion is to acquire two images with the phase encoding applied in opposite directions. The distortions will likewise be in opposite directions and a mathematical correction can be calculated and applied [27]. This topic is covered in more detail in Chapter 5.
When using any digital technique, the question of sampling occurs. One of the most important theories in digital sampling is the Nyquist sampling theorem, which states that the highest frequency that can be sampled accurately is given by

(2.62)
where T is the interval between sampling points. If the FID contains a frequency component fmax+D then it will appear to have a frequency fmax-D. This manifests itself as 'wrap-around' of the image onto itself. It is possible to reduce this problem in the readout, or switched, direction by using a band-pass filter to cut out any frequencies that could alias. In the phase encode, or blipped direction, it is necessary to ensure that there are enough sample points for the amount of phase encoding applied. An alternative is to suppress the signal from outside the field of view, using selective r.f. excitation [28].
There are three further artefacts due to sampling, one specific to 2DFT techniques, and the other two specific to EPI. Firstly, subject motion during the scan causes localised banding. This is not a problem in EPI since the image is acquired in a fraction of a second, but is in the slower sequences such as spin-warp. Depending on the source of the movement, there are a number of solutions. Cardiac or respiratory gating, where the scanning is locked to a particular phase of the respective cycles, is often employed to image the heart. These cycles can be monitored directly, for example using the ECG, or by sampling the phase of the NMR signal just prior to gradient application, known as a navigator echo [29].
Echo planar imaging suffers from a different type of sampling artefact, known as the Nyquist, or N/2 ghost. This is because, in EPI adjacent lines in k-space are sampled under opposite read gradients. If there is any misalignment in sampling, or differences in positive and negative gradients, then there is an alternate line modulation in k-space, which leads to a 'ghosting' of the image, as shown in Figure 2.29d. If the aliased image and the actual image overlap, then banding or fringes appear. The Nyquist ghost can be corrected to a certain extent by applying various phase corrections to the data. One such method acquires a second image with the starting direction of the switched gradient reversed to calculate the phase correction, and is described in more detail in Chapter 4.
Finally, since in EPI to switch the sign of the gradients so rapidly is difficult, the waveform of the switched gradient will not be square. In fact it is common to use a sinusoidal gradient waveform. If simple linear sampling of the signal is used with a sinusoidal gradient a complex ripple artefact in the switched direction is formed. To correct for this, the signal is usually over-sampled and then the points re-gridded to account for the sinusoidal nature of the gradients. Alternatively the sampling points can be distributed sinusoidally, sampling most densely at the peak of the gradient [30].
There are two artefacts that result from using a Fourier transform to create the image. The first is truncation artefact, which is due to the finite number of sampling points used. It is noticeable if there is a sharp intensity change in the image. Instead of a sharp edge in the image there is 'ringing', that is light or dark lines parallel to that edge. The only way to overcome this is to use more sample points.
Another effect is the central point artefact. This is due to the constant DC offset of the FID, which upon Fourier transformation becomes a central bright dot (as shown in Figure 2.29e). This can be reduced by attempting to remove the DC component from the FID, by assuming that the extremities of k-space are unlikely to contain much signal. So the first or last few lines are averaged together and this average is subtracted from all the data. Alternatively, the point can be removed cosmetically by replacing it by the average of surrounding pixels.
One final artefact to mention is that of external r.f. interference. If there is any r.f. radiation at the frequency of the receiver then it will be picked up and appear as a bright dot in the image. The best way to remove this, is to remove all potential interference from the scanner by placing it in a screened room. Figure 2.29f shows r.f. interference from a single frequency that appears as four bars in the echo planar image. The single frequency appears in four regions due to the reversal of the echo acquisition in the alternate lines, and the fact that the quadrature detection has identified both positive and negative components of the signal. The spreading out of the points to bars, is because sinusoidal sampling was employed. A method for removing this artefact from non-linearly sampled images is described in Chapter 4.