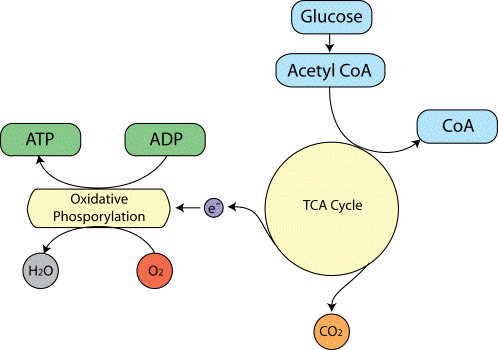
The biochemical reactions that transmit neural information via action potentials and neurotransmitters, all require energy. This energy is provided in the form of ATP, which in turn is produced from glucose by oxidative phosphorylation and the Kreb's cycle (Figure 3.16).

As ATP is hydrolysed to ADP, energy is given up, which can be used to drive biochemical reactions that require free energy. The production of ATP from ADP by oxidative phosphorylation is governed by demand, so that the energy reserves are kept constant. That is to say, the rate of this reaction depends mainly on the level of ADP present. This means that the rate of oxygen consumption by oxidative phosphorylation is a good measure of the rate of use of energy in that area.
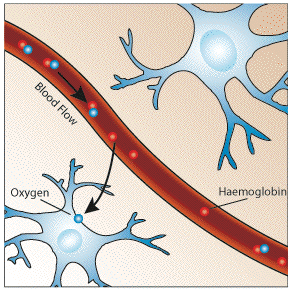
The oxygen required by metabolism is supplied in the blood. Since oxygen is not very soluble in water, the blood contains a protein that oxygen can bind to, called haemoglobin. The important part of the haemoglobin molecule is an iron atom, bound in an organic structure, and it is this iron atom which gives blood it's colour. When an oxygen molecule binds to haemoglobin, it is said to be oxyhaemoglobin, and when no oxygen is bound it is called deoxyhaemoglobin.
To keep up with the high energy demand of the brain, oxygen delivery and blood flow to this organ is quite large. Although the brain's weight is only 2% of the body's, its oxygen consumption rate is 20% of the body's, and blood flow 15%. The blood flow to the grey matter, which is a synapse rich area, is about 10 times that to the white matter per unit volume. Regulation of the regional blood flow is poorly understood, but it is known that localised neural activity results in a rapid selective increase in blood flow to that area.
Since regional blood flow is closely related to neural activity, measurement of the rCBF is useful in studying brain function. It is possible to measure blood perfusion with MRI, using techniques similar to those mentioned in section 2.4.4. However there is another, more sensitive, contrast mechanism which depends on the blood oxygenation level, known as blood oxygen level dependent (BOLD) contrast. The mechanisms behind the BOLD contrast are still to be determined, however there are hypotheses to explain the observed signal changes.
Deoxyhaemoglobin is a paramagnetic molecule whereas oxyhaemoglobin is diamagnetic. The presence of deoxyhaemoglobin in a blood vessel causes a susceptibility difference between the vessel and its surrounding tissue. Such susceptibility differences cause dephasing of the MR proton signal [18], leading to a reduction in the value of T2*. In a T2* weighted imaging experiment, the presence of deoxyhaemoglobin in the blood vessels causes a darkening of the image in those voxels containing vessels[19,20]. Since oxyhaemoglobin is diamagnetic and does not produce the same dephasing, changes in oxygenation of the blood can be observed as the signal changes in T2* weighted images [21,22,23].
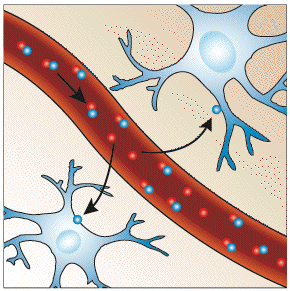
It would be expected that upon neural activity, since oxygen consumption is increased, that the level of deoxyhaemoglobin in the blood would also increase, and the MR signal would decrease. However what is observed is an increase in signal, implying a decrease in deoxyhaemoglobin. This is because upon neural activity, as well as the slight increase in oxygen extraction from the blood, there is a much larger increase in cerebral blood flow, bringing with it more oxyhaemoglobin (Figure 3.17). Thus the bulk effect upon neural activity is a regional decrease in paramagnetic deoxyhaemoglobin, and an increase in signal.
 |
 |
| Resting | Activated |
The study of these mechanisms are helped by results from PET and near-infrared spectroscopy (NIRS) studies. PET has shown that changes in cerebral blood flow and cerebral blood volume upon activation, are not accompanied by any significant increase in tissue oxygen consumption[24]. NIRS can measure the changes in concentrations of oxy- and deoxyhaemoglobin, by looking at the absorbency at different frequencies. Such studies have shown an increase in oxyhaemoglobin, and a decrease deoxyhaemoglobin upon activation. An increase in the total amount of haemoglobin is also observed, reflecting the increase in blood volume upon activation [25].
The time course for the BOLD signal changes is delayed from the onset of the neural activity by a few seconds, and is smooth, representing the changes in blood flow that the technique detects. This is termed the 'haemodynamic response' to the stimulus. There have also been observations of an initial small 'dip' in signal before and after the larger increase in signal [26,27], possibly reflecting a transient imbalance between the metabolic activity and blood flow.
The discovery of the BOLD effect led to many groups trying to map brain activation using the technique. The first MR human brain activation study used an introduced contrast agent to map the visual cortex[28]. Soon after that the BOLD effect was used to map visual and motor function [29,30]. References to the many early fMRI experiments can be found in the review articles on the subject [31,32].
To study brain function using fMRI it is necessary to repeatedly image the brain, whilst the subject is presented with a stimulus or required to carry out some task. The success of the experiment is dependent on three aspects; the scanning sequence used, the design of the stimulus paradigm, and the way the data is analysed.
The magnitude of the static field used is critical to the percentage signal change obtained on activation. This is because susceptibility differences have a greater signal dephasing effect at higher fields. The earliest fMRI studies were carried out at 1.5 Tesla, but now the forefront research facilities use 3 to 4 Tesla scanners. As field strength increases the magnitude of the BOLD contrast increases more rapidly than system noise, so it would appear that higher field strengths are desirable [33], however the image quality will be reduced at higher field.
The most important aspect of the imaging sequence is that it must produce T2* weighted images. This means that a gradient echo is most commonly used, however spin echo sequences still show BOLD contrast because of diffusion effects. Most research is carried out using EPI since its fast acquisition rate allows the activation response to short stimuli to be detected. EPI also has the benefit of reduced artefact from subject motion.
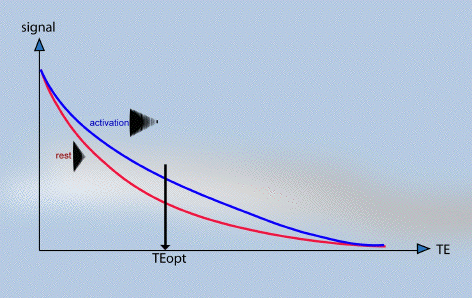
The amount of T2* weighting in the image is dependent on the echo time TE. If TE is too short, there will be little difference in the T2* curves for the activated state and the resting state, however if TE is too long then there will be no signal from either state. To obtain the maximum signal change for a region with a particular value of T2*, the optimal value of echo time can be shown to be equal to the T2* value of that tissue (Figure 3.18).

The contrast to noise ratio of the BOLD signal also depends on voxel size and slice thickness. Smaller voxels have less proton signal due to the reduced number of spins, however larger voxels may reduce the contrast to noise ratio by partial volume effects. This occurs if the signal changes on activation come from only a small region within the voxel, and so makes less of an impact on the total signal change in that voxel.
During the scanning there are a number of physiological effects that can affect results. These include cardiac pulsation, respiration and general subject movement. All these problems can be dealt with in two ways, either at the time of scanning or in image post processing. Cardiac or respiratory gating, that is triggering the scanner at one part of the cardiac cycle can be used, although this introduces artefact due to changes in the spin saturation. Postprocessing strategies have been proposed and are probably the best way to deal with this problem [34]. Subject movement can also reduce contrast to noise in fMRI images, and introduce artefact in the activation maps if the movement is stimulus correlated. This problem is often solved both by restraining the head of the subject and by using a postprocessing registration algorithm.
Another source of artefact in fMRI is the signal coming from draining veins. Since gradient echo images are sensitive to vessels of diameters from micrometers to millimetres, it can be difficult to distinguish between signals from the tissue and that from the veins, which could be some distance away from the activation site [35]. There is also the problem that blood flowing into the imaging slice may be stimulus correlated. One way to reduce the signal from large vessels would be to use a spin echo sequence. This is sensitive to T2 effects only and eliminates the dephasing effects from the large vessels [36,37]. Using a spin echo sequence will result in some reduction in genuine tissue BOLD signal, so often it is better to acquire a separate set of images which are sensitive to large vessels, and use this to decide whether to reject the signal.
The choice of the optimum parameters for fMRI is always a compromise, and often depends more on what is available than what is desirable. More is said on the optimisation of MRI for brain imaging in Chapter 4.
As important as choosing the imaging parameters for a good experiment is designing the stimulus paradigm. A lot of experience has come from EEG and PET, but since fMRI has a temporal resolution somewhere between these two techniques new approaches can be taken. There are many issues in paradigm design, so only an overview will be given here, with more specific examples of the adaptation of paradigms given in Chapter 7.
The earliest fMRI experiments were much in the form of PET studies, that is to say a set of resting images were acquired and then a set of activation images, and one set subtracted from the other. However since the BOLD contrast is relatively rapid in its onset and decay (of the order of a few seconds) it is possible to follow time courses for much shorter events occurring more frequently.
The most common stimulus presentation pattern is that of regular epochs of stimulus and rest, usually labelled 'on' and 'off'. The duration of these epochs needs to be long enough to accommodate the haemodynamic response, and so a value of at least 8 seconds, or more commonly 16 seconds is chosen. These epochs are repeated for as long as is necessary to gain enough contrast to noise to detect the activation response. The total experimental duration however must be a balance between how long the subject can comfortably lie still without moving, and the number of data points required to obtain enough contrast to noise. There are often some technical limitations to the experimental duration, and there is the possibility of the subject habituating to the stimulus causing the BOLD contrast to reduce with time.
Instead of epochs of stimuli, it is possible to use single events as a stimulus, much in the same way that EEG or MEG does. Again due to the haemodynamic response, these must be separated by a much longer period of time than would be required for EEG, but since this type of stimulus presentation has the major advantage of being able to separate out the relative timings of activations in different areas of the brain. One of the major disadvantages of single event paradigms is that the experiments need to be much longer than their epoch based counterparts, in order to gain the necessary contrast to noise. More is said on the design of single event paradigms in Chapter 7.
The choice of stimulus is very critical. For example, to activate the primary visual cortex is straightforward, but to determine the regions responsible for colour discrimination is more difficult. Ideally it is necessary to design the 'on' and 'off' epoch such that there is only one well defined difference between them, which will only activate those brain regions responsible for the single task. This is not always possible and so a hierarchy of experiments often need to be performed. For example to identify the regions responsible for task A, an experiment can be performed which involves task A and task B, and then one which only involves task B. The regions responsible for task A would presumably be those activated in the first experiment but not the second. This assumes that the system is a linear one, which may not be the case, or there could be some unaccounted for differences in the two paradigms, which could affect the result.
Another problem particularly when dealing with cognitive events such as memory, is that some stimulus must be presented, usually visually, and a subject response given, usually involving motor action. These must either be compensated for by being included in the 'off' period as well, or another experiment must be performed later which involves similar stimulus and response, but not the cognitive task performed in the original experiment. Alternatively the stimulus may be presented in a different way, aurally for example, and response given orally, and those regions common to both stimulus presentation types can be assumed to be responsible for the cognitive task of interest.
There are a few stimuli which are hard to present in an fMRI experiment. One obvious one is an auditory stimulus. The rapid imaging scanners are very noisy in their operation, especially if EPI is used. Although aural cues can usually be heard, they are not as easily detected as visually presented cues, and detecting activations in the primary auditory cortex is very difficult since there is always a large amount of ambient sound throughout both 'on' and 'off' periods. Requiring the subject to respond orally is also problematic since this almost always results in head movement, which would be concurrent with the stimulus. All response movements required need to be small to reduce head motion during the scanning.
The subject needs to have good instructions, and be reminded to lie still, and to concentrate. Many stimuli give better activation if a response is required to be made. There is much more that could be said on good paradigm design, and much is still being learnt, however care must always be taken and much thought be given for any new experiment.
The statistical analysis of fMRI data is the subject of the sixth chapter of this thesis, and covered in much more detail there. However to complete this section on functional MRI a few of the common analysis strategies are given here.
The analysis of fMRI data falls into two parts. Firstly the raw data must be analysed to produce an image showing the regions of activation and secondly, some level of significance must be calculated so that the probability of any of producing such a result purely by chance is suitably low [38].
The most straightforward way to analyse the data is to subtract the mean 'off' image from the mean 'on' image. This has the disadvantage that any small movement of the head can drastically change the pixel intensity at the boundaries of the image. This can give rise to a ring of apparent activation near the brain boundaries. To reduce this effect, and to give a statistic of known distribution, a student's t-test can be used. This biases the result against pixels in either 'on' or 'off' set with very large variability, and so can reduce movement artefact. An image where each pixel is assigned a value based on the output of a statistical test is commonly called a statistical parametric map.
Another commonly used technique is that of correlation coefficient mapping. Here the time response of the activation to the stimulus is predicted, usually with some knowledge of the haemodynamic response, and the correlation coefficient between each pixel time course and this reference function is calculated.
Other methods that have been used include Fourier transformation, which identifies pixels with a high Fourier component an the frequency of stimulus presentation, principal component analysis, which locates regions in the brain which show synchronous activity using eigenfunctions, clustering techniques, which again look for synchrony using iterative methods, and various non-parametric tests which do not require the assumption of normality in the signal distribution. All these have their various strengths and weaknesses, and no doubt new methods or variants will be developed in due course. The main criteria for any technique however is simplicity, speed, statistical validity, and sensitivity.
Having obtained a statistical map it is necessary to display the regions of activation, together with some estimate as to the reliability of the result. If the distribution of the statistic, under the null hypothesis of no activation present, is known, then statistical tables can be used to threshold the image, showing only those pixels which show strong stimulus correlation. When displaying the results as an image usually of several thousand pixels, it is necessary to account for multiple comparisons, since the probability of any one pixel in the image being falsely labelled as active is much greater than the probability of a lone pixel being falsely labelled. There are several ways to account for this, for example the Bonferoni correction or the theory of Gaussian random fields, and this topic is explored in more detail in Chapter 6.