Example 2: Perfusion Analysis using pcASL (GUI)
Introduction
The purpose of this example is essentailly do a better job of the analysis we did in Example 1 on the same data using the BASIL GUI in FSL. Thus this example incorporates various corrections, for motion and distortion, as outlined in Chapter 2 of the primer. The example then goes on to explore calibration (Chapter 5) and partial volume correction (Chapter 6). There is a similar example using the command line tools here.
NOTE that we reccomend you use FSL v6.0.1 (or higher) for these exercises.
For this example you should use the Single PLD pcASL dataset set. This ASL data was acquired using pcASL labelling with a label duration of 1.8 seconds and a post-labelling delay (PLD) of 1.8 seconds, following the recommendations of the ASL consensus paper.
Get the data
Perfusion Quantification
(Primer Example Boxes 1.3, 3.1, 3.2 & 5.1)
We can improve upon the analysis we did in Example 1. First, follow the steps to setup the analysis as for that analysis, but before you hit 'Run' make the following modifications.
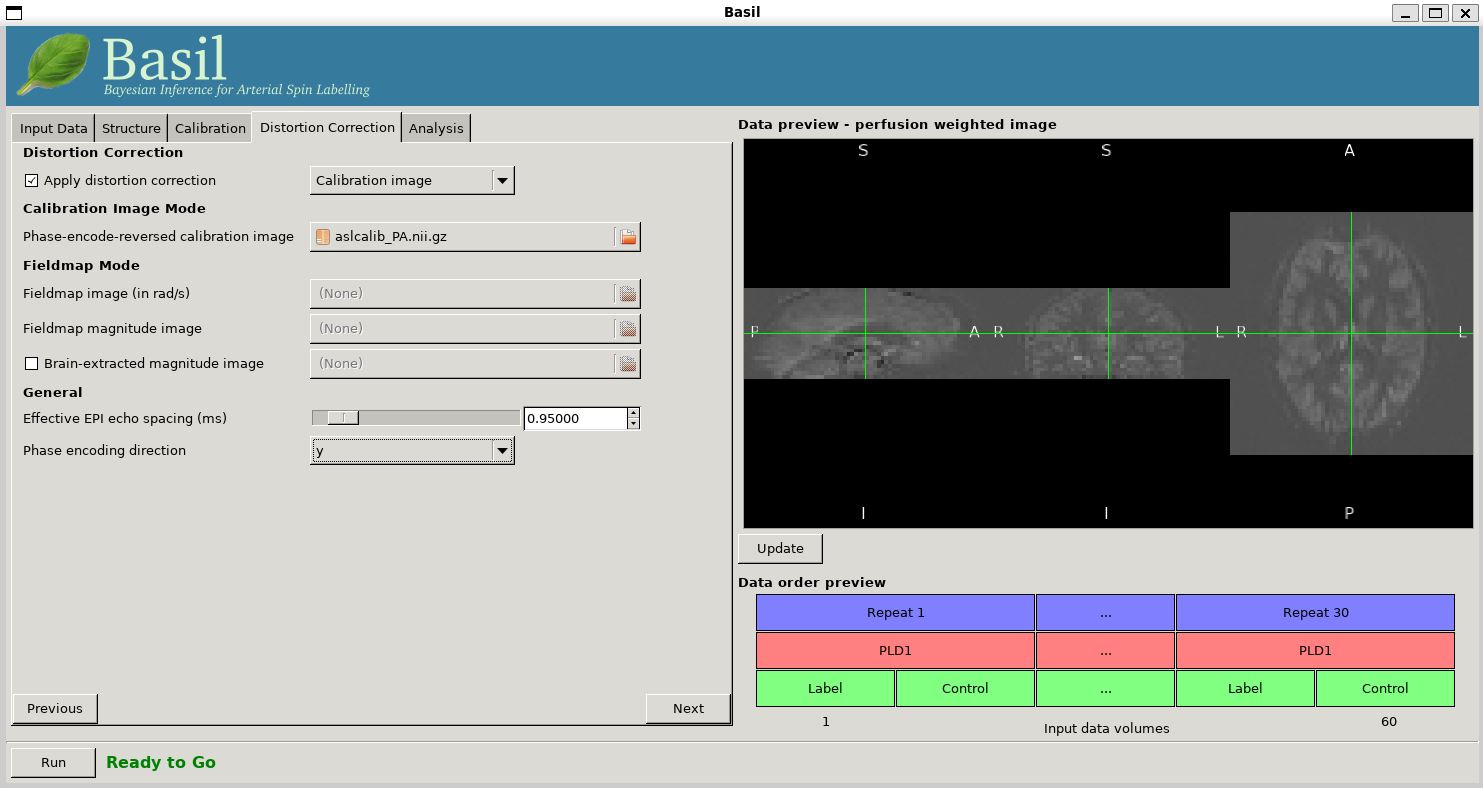
On the 'Distortion Correction' tab, select 'Apply distortion
correction'. Load the 'Phase-encode-reveresed calibration image'
aslcalib_PA.nii.gz. Set the 'Effective EPI echo
spacing' to 0.95ms and the 'Phase encoding direction' to 'y'.
On the 'Analysis' tab, select 'Motion Correction'. Make sure you have 'Adaptive spatial regularisation on perfusion' selected (it is by default). This will reduce the appearance of noise in the final perfusion image using the minimum ammount of smoothing appropriate for the data. Now click 'Run'.
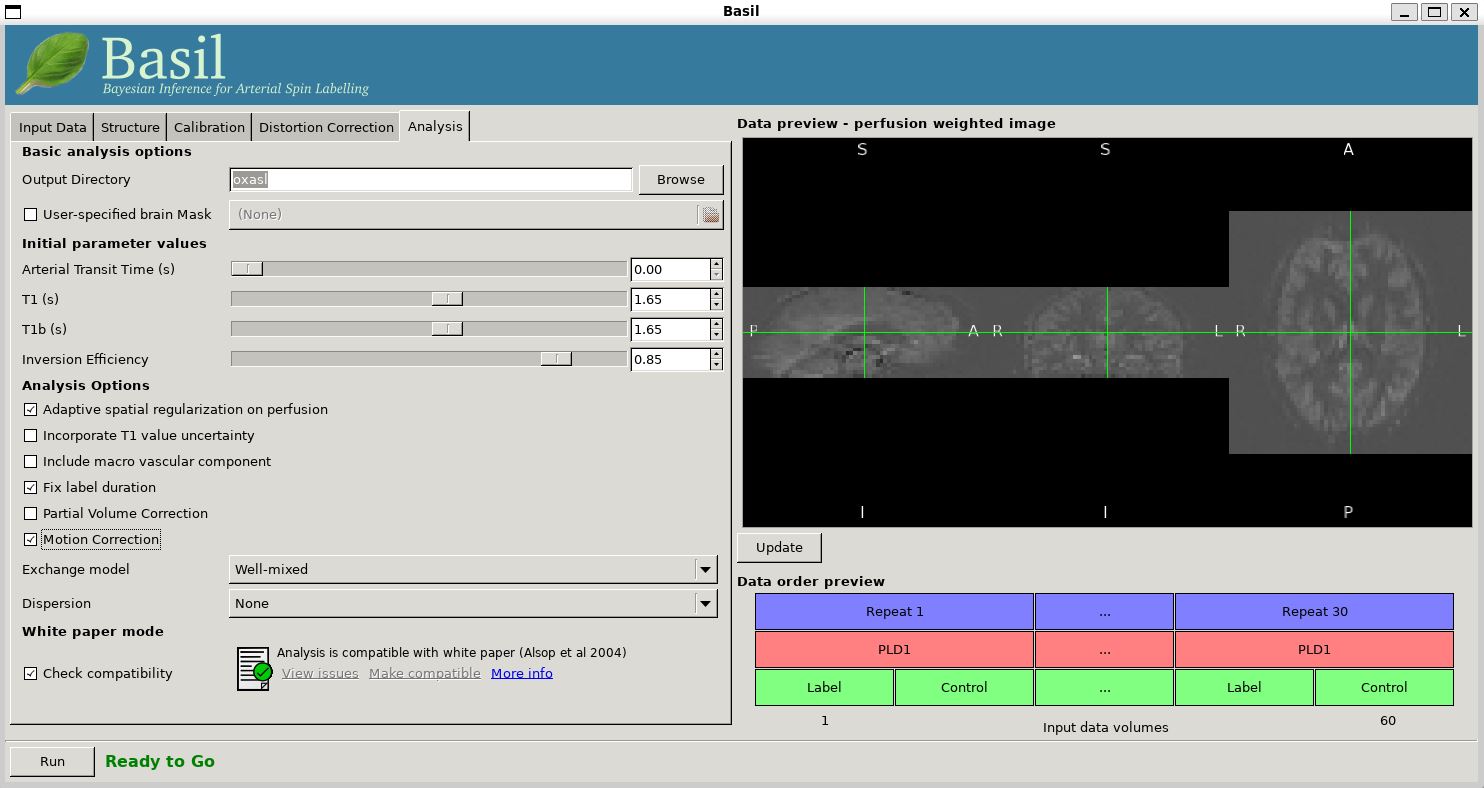
For this analysis we are still in 'White Paper' mode.Specifically this means we are using simplest kinetic model that assumes all delivered blood-water has the same T1 as that of blood (see Chapter 4 of the ASL primer for more information) and that the Arterial Transit Time should be treated as 0 seconds.
To view the final result:
fsleyes oxasl/native_space/perfusion_calib.nii.gz
The result will be similar to the analysis in Example 1 although the effect of distortion correction should be noticeable in the anterior protion of the brain. The effects of motion correction are less obvious, this data does not have a lot of motion corruption in it.
Making use of Structural Images
(Primer Example Boxes 3.4 & 6.1)
Thus far all of the analyses have relied purely on the ASL data alone. However, often you will have a (higher resolution) structural image in the same subject and would like to use this as well, at the very least as part of the proceess to transform the perfusion images into some template space.
We can repeat the analysis above but now providing structural
information. The recommended way to do
this is to take your T1 weighted structural image (which is most
common) and firstly process using fsl_anat, passing the
output directly from that tool to BASIL. You either ask the GUI to do this for you, or run fsl_anat on the T1-weighted
image that came with this dataset with this command:
fsl_anat -i T1.nii.gz
- Go back to the analysis you have setup above. On the 'Structure'
tab, for 'Structural data from' either:
T1.anat, orT1.nii.gz.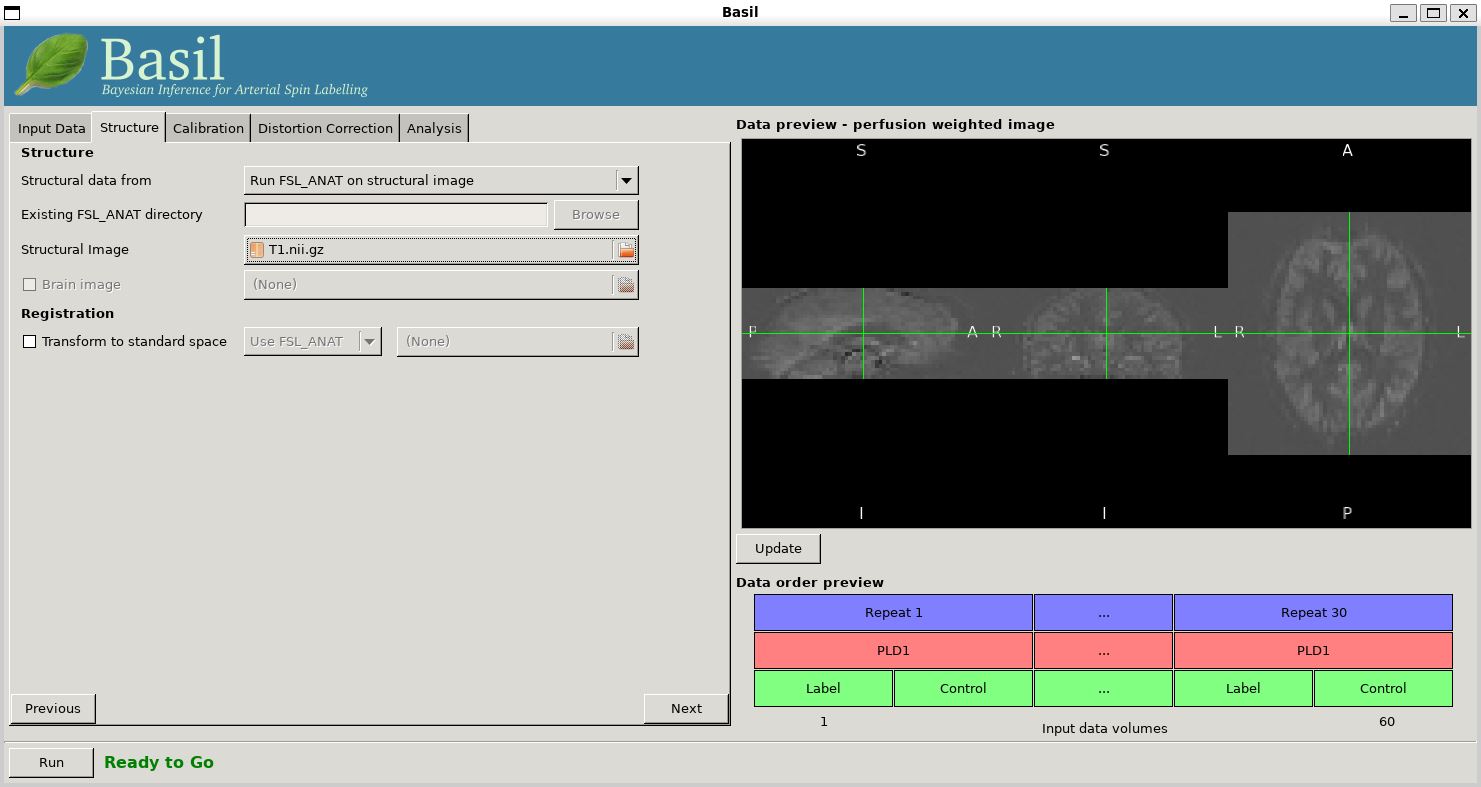
This analysis will take longer overall, although the extra time
is taken up doing fsl_anat and registration between ASL and structural
images.
You will find some new results in the output directory:
oxasl/struct_space - this sub-drectory contains results
transformed into the same space as the structural image. The
files in here will match those in the native_space
subdirectry of the earlier analysis, i.e., containing perfusion
images with and without calibration.oxasl/native_space/asl2struct.mat - this is the
(linear) transformation between ASL and structural space. It can be
used along with a transformation between sturcutral and template
space to transform the ASL data into the template space. It was used
to create the results in oxasl/struct_space.oxasl/native_space/perfusion_calib_gm_mean.txt -
this contains the result of calculating the perfusion within a gray
matter mask, these are in ml/100g/min. The mask was derived from the partial volume estimates
created by fsl_anat and transformed into ASL space
followed by thresholding at 70%. This is a helpful check on the
absolute perfusion values found and it is not aytpical too see
values in the range 30-50 here. There is also a white matter result
(for which a threshold of 90% was used).oxasl/native_space/gm_mask.nii.gz - this is the gray
matter mask used in the above calculations. There is also the
associated white matter mask.oxasl/native_space/gm_roi.nii.gz - this is another
mask that represents areas in which there is some grey matter (at
least 10% from the partial volume estimates). This can be useful for
visualisation, but mainly when looking at partial volume corrected
data.Reference Tissue Calibration
(Primer Examples Boxes 5.3 & 5.4)
Thus far the calibration to get perfsion in units of ml/100g/min has been done using a voxelwise division of the realtive perfusion image by the (suitably corrected) calibration image - so called 'voxelwise' calibration. This is in keeping with the recommendations of the ASL White Paper for a simple to implement quantitative analysis. However, we could also choose to use a reference tissue to derive a single value for the equilirbirum mangetization of arterial blood and use that in the calibnration process.
Go back to the analysis you have already setup. We are now going to turn off 'White Paper' mode and change some options to get a potentially more accurate analysis. To do this return to the 'Analysis' tab and deselect the 'Check Compatibility' option. Then change the 'Arterial Transit Time' from 0 seconds to 1.3 seconds (the default value for pcASL in BASIL based on our experience with pcASL labeling plane placement) and the 'T1' value (for tissue) to 1.3s, different to 'T1b' (for arterial blood), since the Standard (aka Buxton) model for ASL kinetics considers labeled blood both in the vascualture and the tissue.
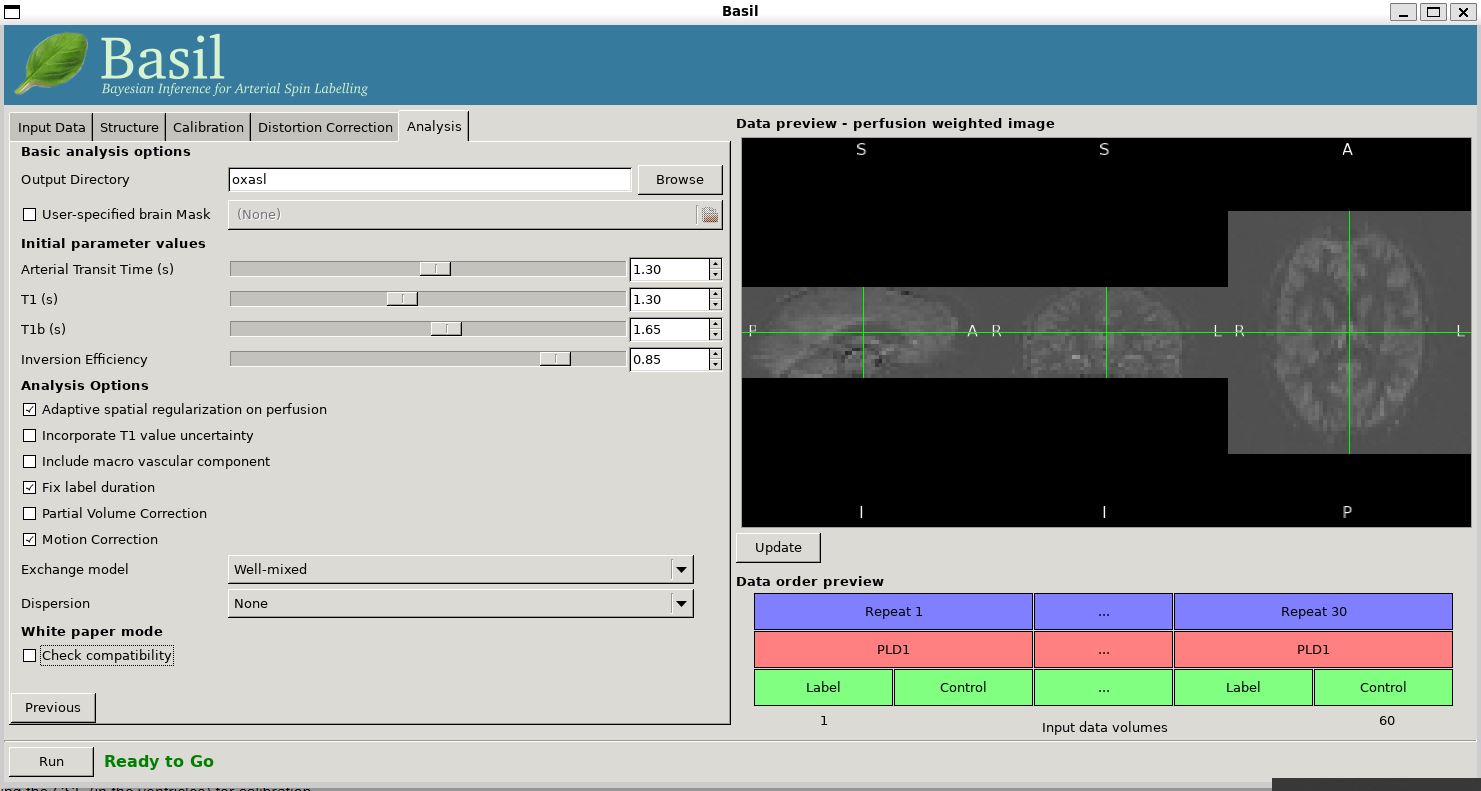
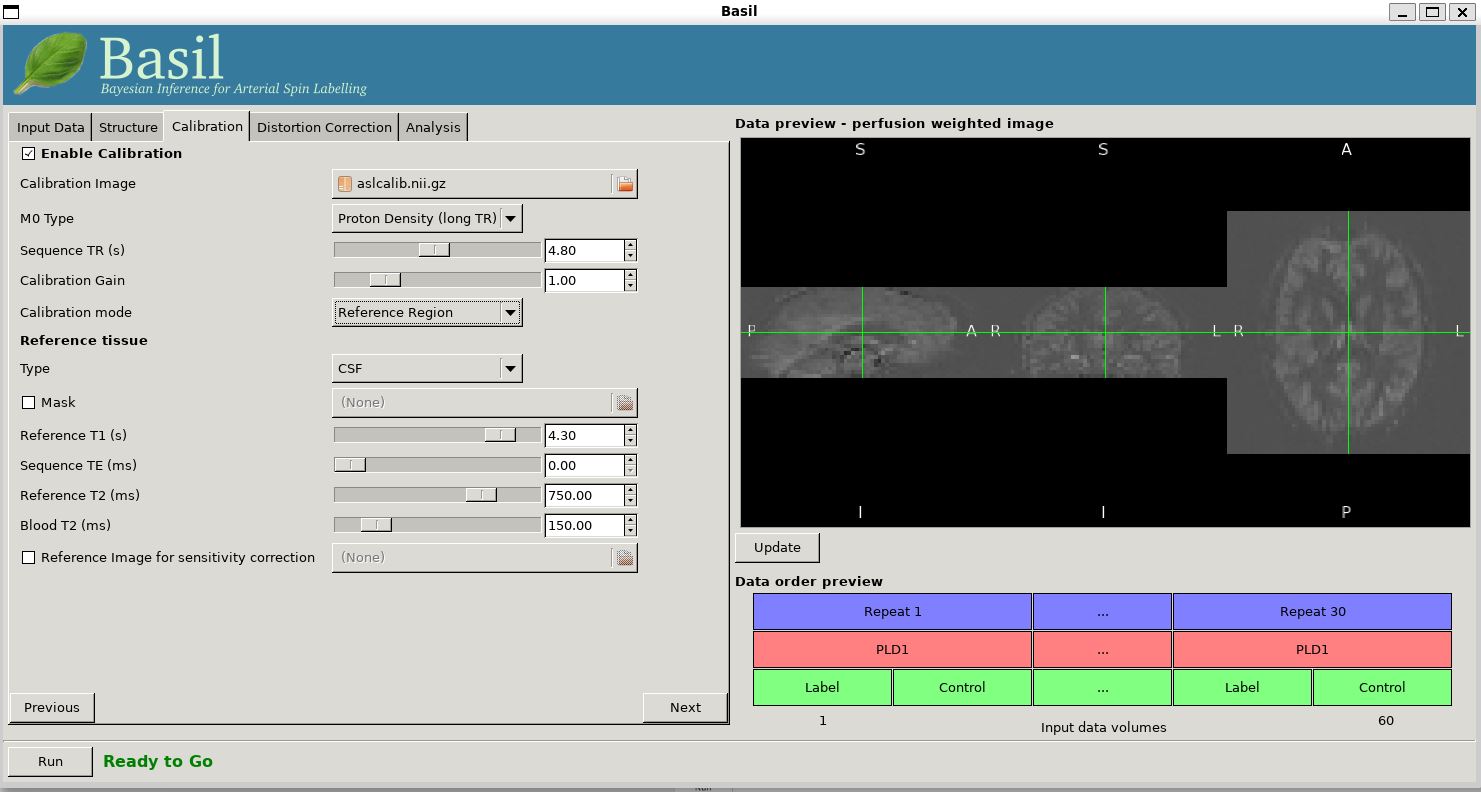
Now that we are not in 'White Paper' mode we can also change the calibration method. On the 'Calibration' tab, change the 'Calibration mode' to 'Reference Region'. Now all of the 'Reference tissue' options will become available, but leave these as they are: we will accept the default option of using the CSF (in the ventricles) for calibration.
The resulting perfusion images should look very similar to those
produced using the voxelwise calibration, and the absolute values
should be similar too. For this, and many datasets, the two methods
are broadly equivalent. You can check on some of the interim
calcuations for the calibration by looking in the
oxasl/calib subdirectory: here you will find the value
of the estimated equilirbirum mangetization of arterial blood for
this dataset in M0.txt and the reference tissue mask in
refmask.nii.gz. It is worth checking that the latter
does indeed only lie in the venticles when overlaid on an ASL image
(e.g. the perfusion image or the calibration image), it should be
conservative, i.e., only select voxels well within the ventricles
and not on the boundary with white matter.
Partial Volume Correction
(Primer Example Box 6.3)
Having dealt with structural image and in the process obtained partial volume estimates we are now in a position to do partial volume correction. This does more than simply attempt to estimate the mean perfusion within the grey matter by the definition of an ROI based on the partial voume estimates, but attempts to derive and image of gray matter perfusion directly (along with a separate image for white matter).
Return to your earlier analysis and now on the 'Analysis' tab select 'Partial Volume Correction'. Then click 'Run'.
In the results directory you will still find an analysis performed
without partial volume correction in oxasl/native_space
as before. The results of partial volume correction can be found in
oxasl/native_space/pvcorr. This new subdirectory has the
same structure as the non-corrected results, only now
perfusion_calib.nii.gz is an estimate of perfusion only
in gray matter, it has been joined by a new set of images for the
estimation of white matter perfusion, e.g.,
perfusion_wm_calib.nii.gz. It may be more helpful to look at
perfusion_calib_masked.nii.gz (and the equivalent
perfusion_wm_calib_masked.nii.gz) since this has been
masked to include only voxels with more than 10% gray matter (or white
matter), i.e., voxels in which it is reasonable to interpret the gray
matter (white matter) perfusion values.