As was mentioned in Chapter 2, since MRI uses a knowledge of the precise magnetic field at any position, at any time, to create a map of proton density, any irregularities in the field are manifested in the image as distortion. Even if the B0 field produced by the magnet is very homogeneous, the presence of a sample containing regions with different magnetic susceptibilities, causes local inhomogeneities in the field. This effect is particularly bad at high field, in the temporal lobes and basal ganglia. Although shimming the sample can reduce the effect, there is always some inhomogeneity in the sample.
The amount by which the inhomogeneities affect the image depends on the frequency per point of the image. Take for example the signal shown in Figure 5.6.

Upon Fourier transformation, the separation in Hertz of adjacent points in the frequency domain is the inverse of the length of time sampled. So that, for example, if the signal is sampled for 100 ms the frequency per point is equal to 10 Hz. Now consider the effect of a local field inhomogeneity of 0.5 parts per million. The proton resonance frequency at 3.0 Tesla is 128 MHz, and so the 0.5 ppm inhomogeneity represents a 64 Hz frequency offset from the expected value. If the difference between adjacent pixels in an image is 10 Hz, then the 64 Hz offset causes a distortion of just over 6 pixels.
In EPI, the broadening direction has a longer sampling time than the switched direction, so distortion occurs mainly in the broadening direction. This is in contrast to 2DFT where distortion only occurs in the read direction. However, the sampling length in 2DFT is usually much shorter than the broadening direction sample time in EPI (see Figure 5.7), making EPI more sensitive to susceptibility induced distortion than 2DFT. With a field inhomogeneity of fixed magnitude, the effect on the image can be reduced by increasing the frequency per point. This can be done by using multi-shot EPI instead of the single shot technique.

If a two shot technique is used, for example, the time spent sampling each FID is reduced by half, thereby increasing the frequency per point by a factor of two. So for an n shot acquisition the distortion is reduced by a factor of n.
An example of the reduction in image distortion is shown in Figure 5.8. These three transaxial slices through the brain have matrix size 128 x 128, and were acquired using single shot (conventional) EPI, two shot and four shot interleaved EPI. They were acquired with a read gradient switching rate of 615 Hz, meaning that the sampling times for the single, two and four shot images were 104 ms, 52 ms and 26 ms respectively. The reduction in distortion in going from single shot to four shot is very apparent, however it can be noted that there is a greater level of ghosting artefact on the four shot image than on the single shot one.
 (b)
(b)  (c)
(c) 
This is the most significant benefit of using interleaved EPI, that by increasing the number of interleaves, the level of the distortion in the image due to field inhomogeneity reduces.
A second benefit of interleaved EPI is in the reduction in linewidth, which results again from the increase in frequency per point in the image.
As was described in Chapter 2, spin-spin relaxation and the effect of field inhomogeneity causes the transverse magnetisation to decay, with a time constant T2*. This has the effect of convolving the image with a point spread function, as shown in Figure 5.9.

The point spread function is the Fourier Transform of the T2* decay
 ,
,
(5.5)
and has the form
 .
.
(5.6)
If two points of equal magnitude in the image are separated by Dw, then the total signal as a function of w is of the form
 .
.
(5.7)
The Rayleigh criterion [7] states that two pixels are resolved when two pixels of intensity S0, are separated by one of intensity less than 0.81S0, as shown in Figure 5.10.

So using the condition

(5.8)
the minimum frequency per point separation required to obtain true pixel resolution is given by
 .
.
(5.9)
Thus for a typical value of T2* at 3 T of 60 ms, the required frequency per point is 16 Hz. If high resolution imaging is being carried out then it is quite possible that the pixel resolution is not the true resolution. For example, acquiring a 2562 matrix with a switched gradient frequency of 500 Hz using conventional EPI will give a frequency per point of just under 4 Hz. This is below the 16 Hz frequency per point required for true pixel resolution. However by using a two shot interleaved EPI technique the frequency per point will increase to 8 Hz, and a four shot technique will double this value again to about 16 Hz.
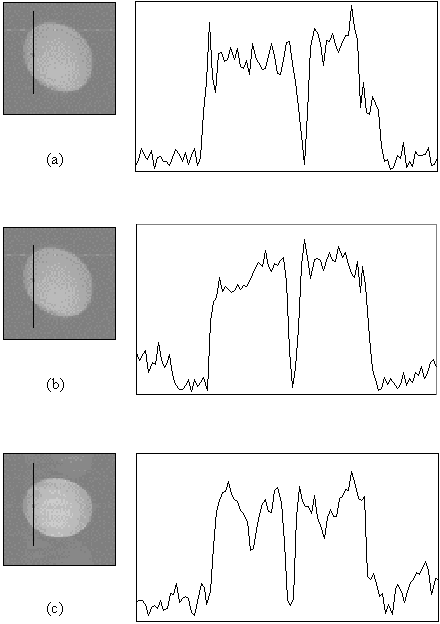
Figure 5.11 shows three images of a cylindrical phantom containing a 3 mm diameter glass rod, surrounded by water doped to have a T2* similar to the brain. The phantom is imaged to a pixel resolution of 1 mm, with single shot, two shot and four shot EPI, and line profiles through the rod, as indicated by the black line on the images, are shown. The line profile shows a clear increase in definition of the glass rod in the four shot case, compared to the single shot case, indicating the improvement in real resolution obtained in this case by using interleaved EPI.

There are several approaches that can be taken in using interleaved EPI to improve the results of an fMRI experiment.
If for example the fMRI image is of poor quality, due to susceptibility distortions, the distortion can be reduced by using interleaved EPI whilst maintaining the same resolution. The distortion in this case will be reduced by the number of interleaves used.
Alternatively, if the level of distortion is acceptable, the resolution can be increased by reducing the switched gradient frequency by half and doubling the number of interleaves. The frequency per point in this case will stay the same, and so therefore will the distortion. Interleaved EPI offers real benefits in carrying out high resolution fMRI at high field.
Without increasing the resolution or the distortion, the benefits of interleaved EPI can be seen in an increased signal to noise ratio, and reduced gradient current requirements. This can be achieved by lowering the switched gradient frequency, thereby increasing the time taken to sample one line in k-space. This reduces the sampling bandwidth required and increases the signal to noise ratio by the square root of the number of interleaves used. By reducing the current requirement, the level of gradient heating is also reduced.
For larger matrix sizes and lower gradient switching rates, the linewidth broadening may become a limitation. In this situation, interleaved EPI can be used to regain true resolution.
The combination of gradient switching rate, and matrix size, with the number of interleaves, can bring benefits in resolution, distortion, gradient heating, and signal to noise, although the increased number of acquisitions means that the experimental duration may be longer.
Recently a number of groups have demonstrated the use of interleaved EPI for high resolution fMRI of the visual cortex at high field [8],9] and also the development of the technique to carry out interleaved echo volumar imaging (EVI) [10].
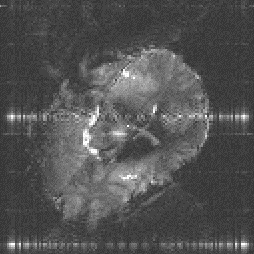
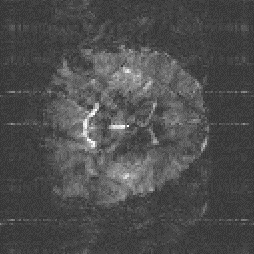
As already mentioned above, any differences in phase or intensity between interleaves will show up in the images as ghosting artefact. These differences can be due to subject movement or instability in the scanner hardware. In addition, the ghosting caused by the reversal of lines acquired under the negative read gradient (Nyquist or N/2 ghost) is made worse since the positive and negative gradient pulses are grouped in blocks by the interleaving. Such artefacts, which change with time make fMRI difficult to perform, particularly at high resolution where signal to noise is low and small movements mean a large pixel displacement. The magnitude of the changes in the image due to artefact are often greater than the contrast changes due to the BOLD effect.
The first line of attack on such problems is to attempt to remove them at source. Motion can be reduced by restraining the subject's head, and by careful planning of the stimulus paradigm. Unfortunately high resolution fMRI using interleaved EPI requires long experiments, due to its low signal to noise. This makes the subject more uncomfortable and prone to move. To reduce the N/2 ghosting problem an asymmetric EPI experiment could be used [11]. This only acquires the data under one polarity of read gradient and so is not quite as efficient as conventional interleaved EPI.
Instability from shot to shot in the hardware can be measured using a navigator echo [12,13]. In its simplest form, a navigator echo is a sample of the FID, prior to the application of the imaging gradients. The phase of this sample can be calculated for each of the interleaves in the image, and then a bulk phase correction applied to normalise the data. This technique was included in the interleaved EPI pulse sequence, acquiring a number of sample points prior to the imaging gradients. The mean phase of these data points was calculated and a phase correction determined to normalise these values for each interleave. These factors were applied to the actual image data prior to Fourier transformation.
Other forms of navigator echoes have been proposed for the correction of interleaved EPI data [14]. In particular, the obvious extension of applying a gradient in one direction during the navigator echo acquisition, so as to make the echo sensitive to uni-directional movement, has been suggested.
Even after applying the navigator correction there is still a significant amount of ghost present, most probably due to subject movement. To reduce this, it is necessary to apply some form of correction to the data in post-processing. The most straightforward correction is a zeroth order phase shift, where the same phase change is applied to every point in the interleave. In order to successfully use such a correction as a post-processing technique on fMRI data, it is necessary to decide upon some measure of the amount of ghosting.
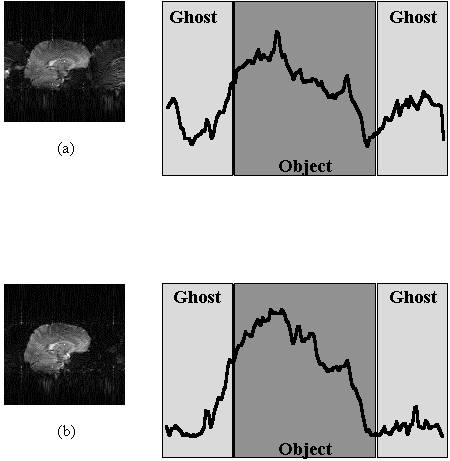
The Fourier transform (FT) of the central column of k-space, represents the D.C. component of each line in the image. The amount of ghost can be determined by selecting this column, applying the phase correction and FT, and measuring the ratio of the central points to the edge points, as shown in Figure 5.12. This method works well for a two shot technique, where the ghost appears at the edges, but is less successful if more interleaves are used and the ghost appears throughout the image.

Since the origin of the artefact is motion, it seems appropriate to apply some form of motion correction. To do this it is necessary to have some measure of how well any processing corrects the data. One possibility is to define the regions where any ghosting would be expected to be manifested and try to reduce the signal intensity in this area [15]. If this is not possible then some other measure of the level of ghosting is required. Atkinson and Hill [16] have suggested that an entropy term of the form

(5.10)
where Si is the intensity of the ith pixel in the image, would be one such measure. They propose motion correcting the interleaves until the term in equation 5.10 is a minimum.
Until a suitable solution for the problem of the ghosting is found, high resolution interleaved EPI will be difficult to use in practice.