
One of the largest problems in using echo planar imaging is the level of image distortion due to susceptibility, that is observed. This can make some structures in the brain, such as the basal ganglia, hard to detect using EPI especially at 3 Tesla. As was mentioned in Chapter 2, the Fourier imaging techniques (2DFT) suffer much less from susceptibility distortion than EPI does, and this is one reason why these techniques are used in routine clinical scans. It is not impossible to carry out fMRI using 2DFT methods, particularly the fast techniques such as FLASH [1], but EPI will always have the speed advantage over such techniques. This is because the entire image is acquired from a single free induction decay (FID), whereas FLASH only acquires one line from each FID.
In order to improve the quality images in fMRI experiments, an approach that can be taken is to use a technique which is a hybrid of EPI and 2DFT, called interleaved EPI. This technique acquires the image in two or more FIDs, thereby trading some of the speed of EPI to gain some of the image quality of 2DFT.
Interleaved EPI was first proposed by McKinnon [2], as a way of implementing EPI on a standard clinical scanner, which did not have the necessary fast ramping gradients. Later it was also demonstrated that the technique could be used for fMRI [3]. Interleaved EPI also has benefits however for scanners which can carry out conventional EPI, ranging from reducing distortion, improving linewidth, to increasing signal to noise.
This chapter describes the theory and implementation of interleaved EPI at 3 Tesla, for use in fMRI experiments. It outlines some of the benefits of using interleaved EPI, and the problems that occur in its use for fMRI.
Interleaved EPI acquires all the data points required to make up the image in several FIDs. The easiest way to picture how this is done is to look at the k-space coverage diagram (Figure 5.1) for a two shot interleaved EPI sequence. The first interleave covers the whole of k-space in alternate lines, and then the second pass fills in the lines between. The same principle holds for any number of interleaves, up until the technique essentially becomes a 2DFT experiment.

The technique is sometimes referred to as segmented EPI, since k-space is covered in two or more segments. There are other ways that k-space can be segmented, for example, acquiring the positive ky values in the first shot, and negative values in the second. It seems appropriate to refer to the kind of technique shown in Figure 5.1 as interleaved EPI, since the two shots are indeed interleaved on reconstruction, and to refer to other multi-shot techniques as segmented EPI.
The pulse sequence diagram required for two shot interleaved EPI is shown in Figure 5.2. Both shots are essentially MBEST modules, but with three differences between the first and second shot. Firstly there is a difference in the length of the pre excursion of the blipped gradient. This ensures that the phase encoding is slightly different for each shot, so that every line of k-space is acquired. Assuming that the magnitude of the blipped pre-excursion gradient is the same as the blipped gradient itself, then the excursion must increase in length by half of the duration of one blip, for each interleave. Since increasing the length of the pre-excursion delays, albeit slightly, the time of the echo, an appropriate delay must be added in the earlier interleave to compensate.
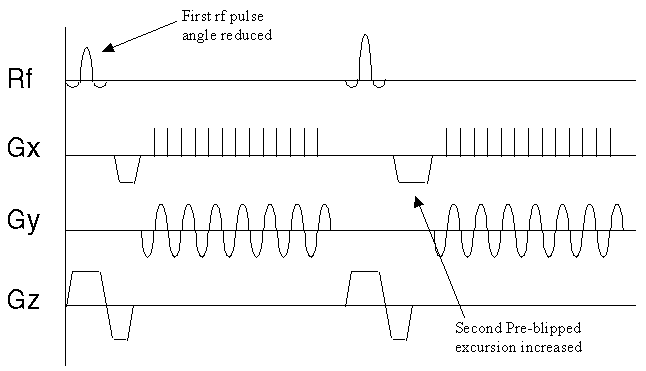
The other two differences relate to discontinuities in the phase and magnitude of the signal along the ky direction in the final image.
The second difference between shots in the pulse sequence diagram relates to the magnitude of the transverse magnetisation vector after the r.f. pulse. If the magnitude of the longitudinal magnetisation prior to the experiment is M0, then following a 90 degree pulse the transverse magnetisation will be M0, and the longitudinal magnetisation will be zero. In the duration, TR, between the first and second r.f. pulses the longitudinal magnetisation will recover through T1 relaxation, and following a second 90 degree pulse the transverse magnetisation will be
 .
.
(5.1)
Unless TR >> T1, the signal intensity of the two interleaves will therefore be significantly different. This leads to discontinuities in k-space and causes ghosting artefact, as demonstrated in Figure 5.3. The effect can be compensated for by reducing the flip angle of the first pulse.
 (b)
(b) 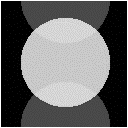


The z-magnetisation prior to the nth interleave is given by

(5.2)
and for constant signal following each excitation
 .
.
(5.3)
These equations can be solved iteratively, with the last flip angle being 90 degree, to find the flip angles for each of the interleaves. These equations only hold for one value of T1, and so discontinuities between interleaves in the signal from tissue with a different value of T1 will still occur. To reduce this problem McKinnon suggests calculating a slightly longer series than necessary, and only using the first part of the series [4].
In using interleaved EPI for fMRI, many images are obtained with a constant repetition rate. This means that a constant flip angle can be used, and after the first few images have been acquired the magnitude of the longitudinal magnetisation reaches a steady state.
The third difference in the pulse sequences between interleaves, acts to reduce phase discontinuities in the time data. Off-resonance phase errors, due to field inhomogeneity, susceptibility and chemical shift, evolve constantly with time. Since in each interleave alternate lines are acquired under opposite read gradients, these lines must be reversed in the time data matrix prior to Fourier transformation. This leads to steps in the phase, which may cause ghosting artefact. This can be a problem in conventional EPI, but the problem is compounded in N shot interleaved EPI, since the first N lines are all acquired at the same time in the echo train, and thus the steps are N times longer (see Figure 5.4a).
To compensate for this, at least along the central line of k-space, a slight time delay of magnitude

(5.4)
is added to the nth interleave (Tx is the time needed to acquire one line in k-space). This has the effect of smoothing out the discontinuities (see Figure 5.4b) [5,6].
Since it is commonly required to image several slices when carrying out an fMRI experiment, the signal to noise ratio can be improved by employing a multi-slice technique. The k-space diagram for multi-slice interleaved EPI is shown in Figure 5.5.

The first shot of every slice is acquired before returning to acquire the second interleave. This increases the steady state transverse magnetisation available after each pulse, and therefore increases the signal to noise ratio.
The benefits are slightly offset by the risk of subject movement during the acquisition. If the movement occurs between the first and second shot of one slice, that image will show artefact as a result. The chances of this occurring is much greater if there is a long delay between shots, as is the case in the multi-slice experiment.
As was mentioned in Chapter 2, since MRI uses a knowledge of the precise magnetic field at any position, at any time, to create a map of proton density, any irregularities in the field are manifested in the image as distortion. Even if the B0 field produced by the magnet is very homogeneous, the presence of a sample containing regions with different magnetic susceptibilities, causes local inhomogeneities in the field. This effect is particularly bad at high field, in the temporal lobes and basal ganglia. Although shimming the sample can reduce the effect, there is always some inhomogeneity in the sample.
The amount by which the inhomogeneities affect the image depends on the frequency per point of the image. Take for example the signal shown in Figure 5.6.

Upon Fourier transformation, the separation in Hertz of adjacent points in the frequency domain is the inverse of the length of time sampled. So that, for example, if the signal is sampled for 100 ms the frequency per point is equal to 10 Hz. Now consider the effect of a local field inhomogeneity of 0.5 parts per million. The proton resonance frequency at 3.0 Tesla is 128 MHz, and so the 0.5 ppm inhomogeneity represents a 64 Hz frequency offset from the expected value. If the difference between adjacent pixels in an image is 10 Hz, then the 64 Hz offset causes a distortion of just over 6 pixels.
In EPI, the broadening direction has a longer sampling time than the switched direction, so distortion occurs mainly in the broadening direction. This is in contrast to 2DFT where distortion only occurs in the read direction. However, the sampling length in 2DFT is usually much shorter than the broadening direction sample time in EPI (see Figure 5.7), making EPI more sensitive to susceptibility induced distortion than 2DFT. With a field inhomogeneity of fixed magnitude, the effect on the image can be reduced by increasing the frequency per point. This can be done by using multi-shot EPI instead of the single shot technique.

If a two shot technique is used, for example, the time spent sampling each FID is reduced by half, thereby increasing the frequency per point by a factor of two. So for an n shot acquisition the distortion is reduced by a factor of n.
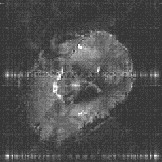
An example of the reduction in image distortion is shown in Figure 5.8. These three transaxial slices through the brain have matrix size 128 x 128, and were acquired using single shot (conventional) EPI, two shot and four shot interleaved EPI. They were acquired with a read gradient switching rate of 615 Hz, meaning that the sampling times for the single, two and four shot images were 104 ms, 52 ms and 26 ms respectively. The reduction in distortion in going from single shot to four shot is very apparent, however it can be noted that there is a greater level of ghosting artefact on the four shot image than on the single shot one.
 (b)
(b) 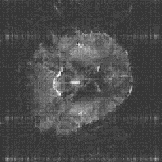 (c)
(c) 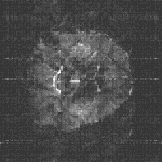
This is the most significant benefit of using interleaved EPI, that by increasing the number of interleaves, the level of the distortion in the image due to field inhomogeneity reduces.
A second benefit of interleaved EPI is in the reduction in linewidth, which results again from the increase in frequency per point in the image.
As was described in Chapter 2, spin-spin relaxation and the effect of field inhomogeneity causes the transverse magnetisation to decay, with a time constant T2*. This has the effect of convolving the image with a point spread function, as shown in Figure 5.9.
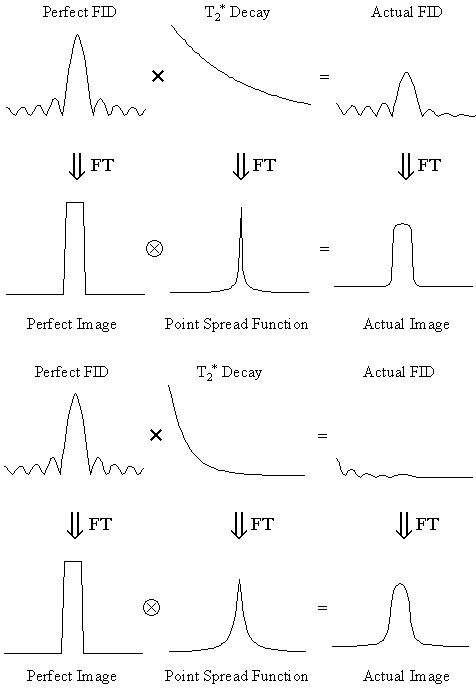
The point spread function is the Fourier Transform of the T2* decay
 ,
,
(5.5)
and has the form
 .
.
(5.6)
If two points of equal magnitude in the image are separated by Dw, then the total signal as a function of w is of the form
 .
.
(5.7)
The Rayleigh criterion [7] states that two pixels are resolved when two pixels of intensity S0, are separated by one of intensity less than 0.81S0, as shown in Figure 5.10.

So using the condition

(5.8)
the minimum frequency per point separation required to obtain true pixel resolution is given by
 .
.
(5.9)
Thus for a typical value of T2* at 3 T of 60 ms, the required frequency per point is 16 Hz. If high resolution imaging is being carried out then it is quite possible that the pixel resolution is not the true resolution. For example, acquiring a 2562 matrix with a switched gradient frequency of 500 Hz using conventional EPI will give a frequency per point of just under 4 Hz. This is below the 16 Hz frequency per point required for true pixel resolution. However by using a two shot interleaved EPI technique the frequency per point will increase to 8 Hz, and a four shot technique will double this value again to about 16 Hz.
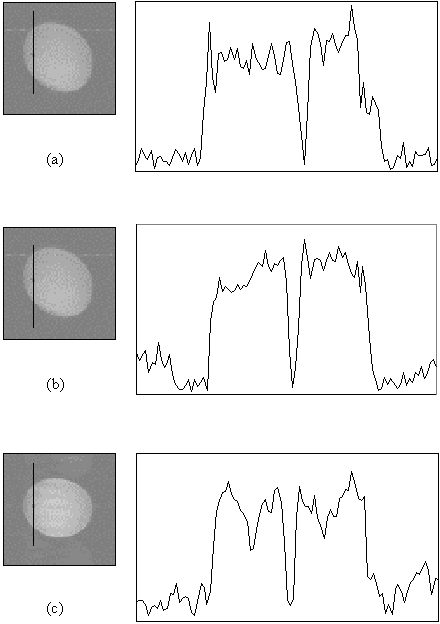
Figure 5.11 shows three images of a cylindrical phantom containing a 3 mm diameter glass rod, surrounded by water doped to have a T2* similar to the brain. The phantom is imaged to a pixel resolution of 1 mm, with single shot, two shot and four shot EPI, and line profiles through the rod, as indicated by the black line on the images, are shown. The line profile shows a clear increase in definition of the glass rod in the four shot case, compared to the single shot case, indicating the improvement in real resolution obtained in this case by using interleaved EPI.
There are several approaches that can be taken in using interleaved EPI to improve the results of an fMRI experiment.
If for example the fMRI image is of poor quality, due to susceptibility distortions, the distortion can be reduced by using interleaved EPI whilst maintaining the same resolution. The distortion in this case will be reduced by the number of interleaves used.
Alternatively, if the level of distortion is acceptable, the resolution can be increased by reducing the switched gradient frequency by half and doubling the number of interleaves. The frequency per point in this case will stay the same, and so therefore will the distortion. Interleaved EPI offers real benefits in carrying out high resolution fMRI at high field.
Without increasing the resolution or the distortion, the benefits of interleaved EPI can be seen in an increased signal to noise ratio, and reduced gradient current requirements. This can be achieved by lowering the switched gradient frequency, thereby increasing the time taken to sample one line in k-space. This reduces the sampling bandwidth required and increases the signal to noise ratio by the square root of the number of interleaves used. By reducing the current requirement, the level of gradient heating is also reduced.
For larger matrix sizes and lower gradient switching rates, the linewidth broadening may become a limitation. In this situation, interleaved EPI can be used to regain true resolution.
The combination of gradient switching rate, and matrix size, with the number of interleaves, can bring benefits in resolution, distortion, gradient heating, and signal to noise, although the increased number of acquisitions means that the experimental duration may be longer.
Recently a number of groups have demonstrated the use of interleaved EPI for high resolution fMRI of the visual cortex at high field [8],9] and also the development of the technique to carry out interleaved echo volumar imaging (EVI) [10].
As already mentioned above, any differences in phase or intensity between interleaves will show up in the images as ghosting artefact. These differences can be due to subject movement or instability in the scanner hardware. In addition, the ghosting caused by the reversal of lines acquired under the negative read gradient (Nyquist or N/2 ghost) is made worse since the positive and negative gradient pulses are grouped in blocks by the interleaving. Such artefacts, which change with time make fMRI difficult to perform, particularly at high resolution where signal to noise is low and small movements mean a large pixel displacement. The magnitude of the changes in the image due to artefact are often greater than the contrast changes due to the BOLD effect.
The first line of attack on such problems is to attempt to remove them at source. Motion can be reduced by restraining the subject's head, and by careful planning of the stimulus paradigm. Unfortunately high resolution fMRI using interleaved EPI requires long experiments, due to its low signal to noise. This makes the subject more uncomfortable and prone to move. To reduce the N/2 ghosting problem an asymmetric EPI experiment could be used [11]. This only acquires the data under one polarity of read gradient and so is not quite as efficient as conventional interleaved EPI.
Instability from shot to shot in the hardware can be measured using a navigator echo [12,13]. In its simplest form, a navigator echo is a sample of the FID, prior to the application of the imaging gradients. The phase of this sample can be calculated for each of the interleaves in the image, and then a bulk phase correction applied to normalise the data. This technique was included in the interleaved EPI pulse sequence, acquiring a number of sample points prior to the imaging gradients. The mean phase of these data points was calculated and a phase correction determined to normalise these values for each interleave. These factors were applied to the actual image data prior to Fourier transformation.
Other forms of navigator echoes have been proposed for the correction of interleaved EPI data [14]. In particular, the obvious extension of applying a gradient in one direction during the navigator echo acquisition, so as to make the echo sensitive to uni-directional movement, has been suggested.
Even after applying the navigator correction there is still a significant amount of ghost present, most probably due to subject movement. To reduce this, it is necessary to apply some form of correction to the data in post-processing. The most straightforward correction is a zeroth order phase shift, where the same phase change is applied to every point in the interleave. In order to successfully use such a correction as a post-processing technique on fMRI data, it is necessary to decide upon some measure of the amount of ghosting.
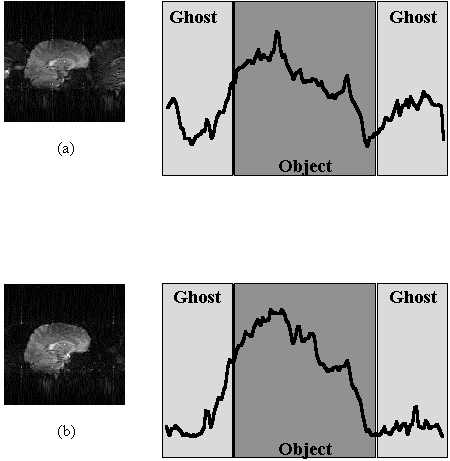
The Fourier transform (FT) of the central column of k-space, represents the D.C. component of each line in the image. The amount of ghost can be determined by selecting this column, applying the phase correction and FT, and measuring the ratio of the central points to the edge points, as shown in Figure 5.12. This method works well for a two shot technique, where the ghost appears at the edges, but is less successful if more interleaves are used and the ghost appears throughout the image.
Since the origin of the artefact is motion, it seems appropriate to apply some form of motion correction. To do this it is necessary to have some measure of how well any processing corrects the data. One possibility is to define the regions where any ghosting would be expected to be manifested and try to reduce the signal intensity in this area [15]. If this is not possible then some other measure of the level of ghosting is required. Atkinson and Hill [16] have suggested that an entropy term of the form

(5.10)
where Si is the intensity of the ith pixel in the image, would be one such measure. They propose motion correcting the interleaves until the term in equation 5.10 is a minimum.
Until a suitable solution for the problem of the ghosting is found, high resolution interleaved EPI will be difficult to use in practice.
To demonstrate the viability of using interleaved EPI to carry out fMRI at 3.0 Tesla, three experiments were performed.
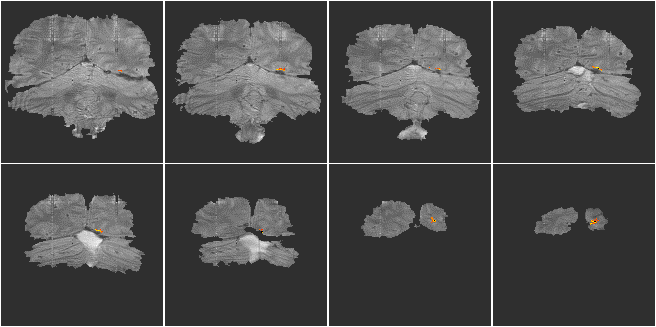
A two shot multislice interleaved EPI technique was used to acquire a 256 x 256 matrix size image, using a switching rate of 1.04 kHz. Eight slices of thickness 4.5 mm, covering the visual cortex were acquired in eight seconds, during periods of visual stimulation from the pattern reversal (4 Hz) of a checkerboard pattern. There were 32 seconds of stimulation followed by 32 seconds of rest, repeated 16 times. The in-plane resolution was 0.75 x 0.91 mm2. A zeroth order phase correction was applied to one interleave, until the Fourier transform of the central line of k-space had the maximum ratio of signal in the inner points to signal in the outer points. The images were re-registered, but no spatial or temporal smoothing applied. The fMRI data was correlated to a square wave of the same period and phase as the stimulus and p-values calculated on the basis on peak height and spatial extent of the correlation maps using the theory of Gaussian random fields (see Chapter 6).
The resulting activation map is shown in Figure 5.13. The coloured regions represent the regions that correlate well to the stimulus (p>0.05). The background images are the average of the actual fMRI data set, so that the resolution seen in these images is the same as that of the activation maps. Regions of activation can be seen in the primary visual cortex and visual association areas. The change in the primary visual cortex upon activation was approximately 20%.
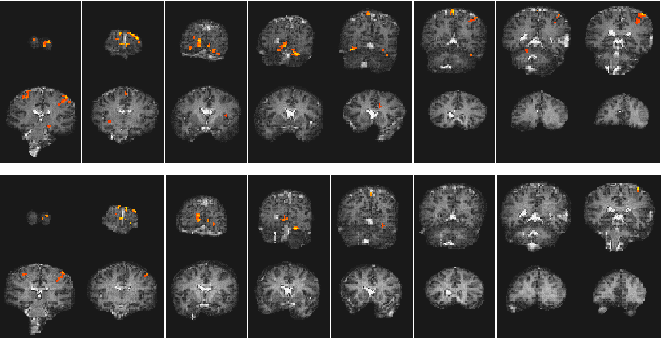
Low distortion EPI images were acquired using a two shot multislice interleaved EPI technique with a matrix size of 128 x 128 and a switching rate of 1.9 kHz. These were compared with images from a single shot experiment with the same matrix size. The activation paradigm consisted of 32 seconds of the subject observing the pattern reversal (4 Hz) of a checkerboard display whilst finger tapping, followed by 32 seconds of rest, repeated eight times. The whole brain, in each experiment, was scanned in 16 slices, in a period of 8 seconds. The images were registered and spatially smoothed (FWHM 4 mm), and correlated to a square wave of the same period and phase as the stimulus. Activation maps were thresholded, using the theory of Gaussian random fields, based on peak height and spatial extent. The activation maps were overlaid on white matter inversion recovery images (TI 1200 ms) acquired using either the single shot or two shot technique.
The resulting images are shown in Figure 5.14. Both methods produced very similar activation maps, with slightly more activation detected in the single shot technique. This is because the shot-to-shot signal to noise was not quite as good in the two shot experiment, presumably due to slight subject movement between interleaves. The level of distortion is slightly less in the two shot case and these results demonstrate the viability of carrying out low distortion interleaved EPI at 3.0 T.
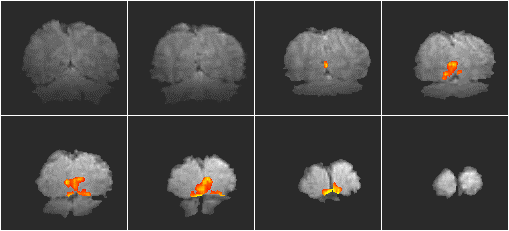
One final application of interleaved EPI is to produce high resolution anatomical images to overlay the activation data on, with the level of distortion being the same in each case, allowing direct superposition.
A single shot EPI, functional imaging experiment was performed using a matrix size of 128 x 64, and a switching rate of 1.04 kHz. The activation paradigm consisted of 16 seconds of viewing a flashing LED display, and pressing a hand held button at the same rate, followed by 16 seconds of rest, repeated 16 times. The visual cortex was scanned in eight slices, every 2 seconds (resolution 3 x 3 x 9 mm3). Following the activation experiment, the switched and broadening gradient strengths were doubled and four volume images of the same slices were obtained using a two shot interleaved EPI sequence, having twice the in-plane resolution (1.5 x 1.5 mm2). These were used as background images for the activation maps to be overlaid upon. The activation maps were interpolated up to twice their size, and registered to the high resolution images. The activation images are shown in Figure 5.15.
The results show that high resolution fMRI has the potential to detect small regions of functional activity. If such high resolution images are to be obtained then a multi shot EPI sequence is most probably required so that the images do not suffer too greatly from distortion. The main problem with high resolution interleaved EPI is the artefact caused by subject movement, and until a robust post-processing correction technique has been demonstrated, it is going to be difficult to gain useful results.
The interleaved EPI sequence however still has other applications on a high gradient performance 3.0 Tesla scanner. The reduction in distortion that the multi shot techniques brings, will benefit studies of the basal structures of the brain in particular. The ability to obtain high resolution anatomical images, with the same distortion as the original activation images, allows confident anatomical localisation of the activation, since the resolution is higher than the single shot images, but there will be less risk of mis-registration of structures in the functional images to the anatomical images that might be the case if 2DFT images were used.
[1] Frahm, J., Merboldt, K.-D. and Hänicke, W. (1993) Functional MRI of Human Brain Activation at High Spatial Resolution. Magn. Reson. Med. 29,139-144.
[2] McKinnon, G. C., Eichenberger, A. C., von Weymarn, C. A. and von Schulthess, G. K. (1992) Ultra-Fast Imaging Using an Interleaved Gradient Echo Planar Sequence in Book of Abstracts, 11th Annual Meeting, Society of Magnetic Resonance in Medicine p.106.
[3] Butts, K., Riederer, S. J., Ehman, R. L., Thompson, R. M. and Jack, C. R. (1994) Interleaved Echo Planar Imaging on a Standard MRI System. Magn. Reson. Med. 31,67-72.
[4] McKinnon, G. C. (1993) Ultrafast Interleaved Gradient-Echo-Planar Imaging on a Standard Scanner. Magn. Reson. Med. 30,609-616.
[5] Feinberg, D. A. and Oshio, K. (1994) Phase Errors in Multi-Shot Echo Planar Imaging. Magn. Reson. Med. 32,535-539.
[6] Mugler III, J. P. and Brookeman, J. R. (1996) Off-Resonance Image Artefacts in Interleaved-EPI and GRASE Pulse Sequences. Magn. Reson. Med. 36,306-313.
[7] Lord Rayleigh (1879) Investigations in Optics with special reference to the Spectroscope. Phil. Mag. 8,261-274.
[8] Kim, S.-G., Hu, X., Adriany, G. and Ugurbil., K. (1996) Fast Interleaved Echo-Planar Imaging with Navigator: High Resolution Anatomic and Functional Images at 4 Tesla. Magn. Reson. Med. 35,895-902.
[9] Thulborn, K. R., Voyvodic, J., Chang, S. Y., Song, D., Blankenberg, F., Davis, D. and Zeki, S. (1997) High Spatial Resolution, Echo-Planar fMRI at 3.0 Tesla Resolves Specialized Functions of the Human Visual Cortex in Book of Abstracts, 5th Annual Meeting, International Society of Magnetic Resonance in Medicine p.7.
[11] Tan, S. G., Wong, E. C., Li, S.-J., Song, A. W. and Hyde, J. S. (1995) Interleaved Echo Volumar Imaging in Book of Abstracts, 3rd Annual Meeting, Society of Magnetic Resonance p.620.
[12] Hennel, F. and Nédélec, J.-F. (1995) Interleaved Asymmetric Echo-Planar Imaging. Magn. Reson. Med. 34,520-524.
[13] Ehman, R. L. and Felmlee, J. P. (1989) Adaptive Technique for High-Definition MR Imaging of Moving Structures. Radiology 173,255-263.
[14] Hu, X. and Kim, S.-G. (1994) Reduction of Signal Fluctuation in Functional MRI Using Navigator Echoes. Magn. Reson. Med. 31,495-503.
[15] Kim, S.-G., Hu, X., Adriany, G. and Ugurbil., K. (1996) Fast Interleaved Echo-Planar Imaging with Navigator: High Resolution Anatomic and Functional Images at 4 Tesla. Magn. Reson. Med. 35,895-902.
[16] Robson, M. D., Anderson, A. W. and Gore, J. C. (1997) Diffusion-Weighted Multiple Shot Echo Planar Imaging of Humans without Navigation. Magn. Reson. Med. 38,82-88.
[17] Atkinson, D. and Hill, D. Private communication.