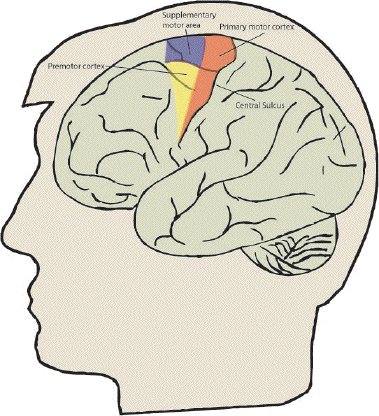
The ability to control our movement is something that most of us take for granted. From the swift responses required to hit a cricket ball, to the delicate and steady action of surgeon, the brain is able to control the muscles in the body in a precise and efficient way. Motor function is controlled by four major regions in the frontal lobes; the primary motor cortex, supplementary motor area (SMA), lateral premotor cortex and the cingulate motor area (shown in Figure 7.1). The primary motor cortex is responsible for the direct production of movements via it's outputs to the pyramidal tract, and damage to these areas resulting from stroke produces a weakness in the corresponding part of the body. The other three areas are responsible for higher order control of motor function.

Studies of the SMA using PET have shown that the it is involved in motor task sequencing and movement initiation [1], however it has more recently been suggested on the basis of animal studies that the SMA could be divided into two discrete areas; the preSMA and the SMA proper [2]. The SMA proper, projecting to and receiving inputs from the primary motor cortex, it is suggested is more directly responsible for movement execution, whereas the pre-SMA, receiving inputs from the prefrontal cortex and the cingulate motor areas, might be responsible for movement decision making.
In order to test this hypothesis on humans, using fMRI, it was necessary to use an experiment that allows the elements of decision making and movement to be separated. Such an experiment would be difficult to carry out in a standard epoch based paradigm with activation lasting for a number of seconds. This would require a number of movement decision making tasks to be carried out in each epoch, and separation of the areas responsible for the execution of the movement from those responsible for the decision making would be impossible. Instead of this, single event paradigms were developed, where one movement decision task was performed every 20 seconds or so, allowing discrimination between areas activated when the decision to move was made and those activated when the decision not to move was made.
In this study the paradigm design, subject handling and data analysis and inference was carried out by Dr. Miles Humberstone [3].
For most paradigms involving the motor cortex, it is necessary to provide some form of cue to the subject to move and, in most cases, a measurement of the movement made.
All our studies involve hand movements since these are the simplest to measure. The cue to move was given from a 6 cm single digit LED display, as sketched in Figure 7.2.

This allowed the presentation of symbols, individual bars or the dot as well as numbers. To measure response times the subject was given two hand held buttons, one for the left hand and one for the right hand, operated by a thumb press. A schematic diagram of the stimulus rig is shown in Figure 7.3.

The experiment was controlled by a PC fitted with an interfacing card [4]. This card had a number of analogue input and output ports, 18 digital lines that could be configured in ports of eight to be either input or output, and three counter-timers. The card produced a 5 V D.C. power supply, which was not enough to drive the LED's, so a Darlington driver IC was used as a buffer to provide the 12 V required. The hand held buttons consisted of a 10 cm tube with a micro-switch mounted on the top. The switch required little force to depress and travelled a couple of millimetres. It had a clear action however, so that the subject would know they had pressed it. The switch formed part of a circuit that held the digital input line to the interfacing card at ground normally, and to 5 V when depressed. A 5 ms TTL trigger from the scanner was obtained for every scan, and this fed to one of the digital input lines on interfacing card.
The counters on the card were arranged in a cascade. Counter 1 received triggers from the PC's internal clock at the rate of 2 MHz, and was set to output one pulse every 2000 triggers, that is every millisecond.
This millisecond trigger was sent to the second counter, which was set to count to 1000, thereby producing a trigger every second.
Counter 3 received this signal and counted to its limit (60,000). Thus any length of time could be measured to a accuracy of milliseconds by reading counters 2 and 3 (see Figure 7.4).

The software to control the stimulus was written in 'C' [5]. The general flow of programs consisted of a loop to count over the cycles, loops to count over the number of stimuli presented per cycle and a loop to repeatedly monitor the scanner triggers, counters and subject buttons. Figure 7.5 shows an example flow diagram for an experiment that presented a 200 ms visual cue every 10 scans and measured the time it took the subject to respond by pressing the button. In this example there are 50 scans of activity and 50 scans of rest, repeated 10 times. Other experiments were programmed in a similar way. Triggering the experiment from the scanner ensured that there were no timing errors. The response times were stored in a data file on the computer for later analysis if required.
The display and buttons could be connected locally to the computer, for testing and subject practice, and connected remotely during the scanning itself. The single digit display was mounted on a plastic support inside the scanner, about 50 cm away from the subjects face.

The initial basis of the paradigm used came from electrophysiological experiments. The oddball paradigm consists of the regular presentation of a stimulus, for example the visual presentation of the digit '2', and infrequently presenting an 'oddball' stimulus such as a '5'. On the presentation of the '5' the subject is required to respond by pressing a button. Regardless of the form the cue stimulus takes, EEG signals from a subject carrying out such a task reveal a peak with a latency of 300 ms, labelled the P300, in response to every oddball stimulus [6].
The implementation of this paradigm for fMRI involved presenting the digits using the LED display described above, at a rate of 2 Hz, with the oddball stimulus occurring at a pseudo-random interval of average 12 s. Analysis of the brain activation of the oddball responses, compared to the interval in between, should reveal those areas involved directly in the movement, including the SMA.
A slight change to the paradigm enabled discrimination between areas involved in the movement decision making and those involved more directly in the movement itself. If the stimuli are presented at a less frequent rate (one every 18 seconds) and the '2' or '5' presented with equal probability, the paradigm is of the form of a 'go, no-go' experiment [7]. The subject again responds only to the '5', but the brain response to the '2' will reveal areas responsible for the movement decision making process. The use of the digits '2' and '5' on the LED display make the stimuli symmetrical and of equal luminance. In total 50 stimuli were presented, with equal numbers of go and no-go stimuli presented in pseudo-random order. Six normal volunteers were studied using the 'go, no-go' paradigm.
The imaging for this experiment was carried out on a dedicated EPI scanner [8]. The static 3.0 Tesla field was produced by a superconducting magnet (Oxford Magnet Technology).
The gradient coils were designed for high uniformity, low heating and high efficiency, especially in the z-axis [9]. The efficiencies of the three axis are: Gx = 0.087 mTm-1A-1; Gy = 0.087 mTm-1A-1; Gz = 0.35 mTm-1A-1. Due to its high efficiency, the z-axis gradient coil was used as the switched axis. This coil was driven as part of a tuned resonant circuit at a frequency of 1.9 kHz, by a bank of 8 power amplifiers (Techron) connected in parallel. The blipped and slice select gradients were driven by 2 and 6 power amplifiers respectively.
A birdcage radiofrequency coil was used, to give the most uniform r.f. field over the whole volume of the brain. R.f. power amplification came from a 10 kW amplifier. Gradient and RF control is carried out by a set of in-house built waveform synthesis modules. These are controlled by a UNIX workstation (Sun Microsystems) via a VME bus [10].
For the motor function experiments there were two requirements of the scanning; whole brain imaging and fast repetition rate. The rate of scanning is largely limited by the heating of the gradient coils and the rate that data can be processed and stored. Using a matrix size of 128 x 128, with an in-plane resolution of 3 x 3 mm2, had the advantage that the brain filled only half of the field of view, meaning that the N/2 ghost did not overlap and interfere with the image (see section 4.3.1). The gradient heating and rate of saving data limited the acquisition of images of this matrix size to four a second (TR = 250 ms).
To improve the repetition rate, a matrix size with half as many lines (128 x 64) was used, allowing a TR of 150 ms if scanning continuously for less than 5 minutes and a TR of 187 ms for less than 30 minutes continuous scanning. The other advantage of using the smaller matrix size is that the total sampling time is reduced by half (from 33 to 16.5 ms), thereby doubling the frequency per point in the broadening direction and halving the distortion (see section 5.3.1).
To cover the whole brain in 9 mm contiguous slices would take 2.4 seconds at the fastest repetition rate (150 ms). To reduce the time taken to acquire each volume required a reduction in the number of slices acquired, either by increasing the slice thickness or reducing the area of brain that is covered. Earlier experiments were carried out using thicker slices, or with volume repetition rates of greater than 2 seconds. When the regions of the brain that were of interest had been ascertained, the slice thickness was kept at 9 mm and 10 slices chosen that covered this region, reducing the volume repetition rate to 1.5 seconds.
Anatomical reference images were obtained for each subject using the fast inversion recovery sequence described in section 4.4. Grey matter null images were obtained using an inversion time of 1200 ms and white matter null images with an inversion time of 400 ms. The slice thickness was reduced to 3 mm for these images and the slices acquired such that three of these images corresponded exactly to one of the functional images.
Various methods were used to restrain the subjects head during scanning. Polystyrene foam, wedged between the perspex former of the r.f. coil and either side of the subjects head was effective but became uncomfortable after 10 minutes or so. In addition the subject could still move their head forward and backward. A more rigid restraint was also tried, with foam ended rods that went into either ear, and a bridge that went across the nose. This was hard to adjust, and extremely uncomfortable for the subject after only a few minutes. The head was well restrained with this method, but the subjects often made deliberate movements during scanning to reduce discomfort.
A third and more successful method was to use inflatable sphygmomanometer cuffs either side of the head. These could be inflated until the subject was comfortable but well restrained. An open-cell polyurathane foam was used underneath the head which was softer and therefore more comfortable than the polystyrene foam. Although the subject was free to move the head forward and backward, the increased comfort attained made them less likely to move in this way. Representations of the three types of restraint are shown in Figure 7.6.

The data from this experiment were analysed using the methods described in Chapter 6. Registration, normalisation, spatial and temporal filtering were carried out using the pre-processing package described in section 6.2.
The statistical analysis used was a serial t-test (section 6.3.4), with a baseline period defined at 3 to 6 seconds prior to the stimulus presentation. The responses to the 'go' stimulus were processed separately to the responses to the 'no-go' stimuli, with any errors in the response excluded from the analysis. This produced two sets of t-statistical parametric maps, which could be analysed using the theory of Gaussian random fields (section 6.4.3).
The activation maps were interpolated up to 60 slices and superimposed directly on the inversion recovery images, displayed as 3-D volumes to help anatomical localisation of the activated regions. Talairach co-ordinates were obtained for each active region.
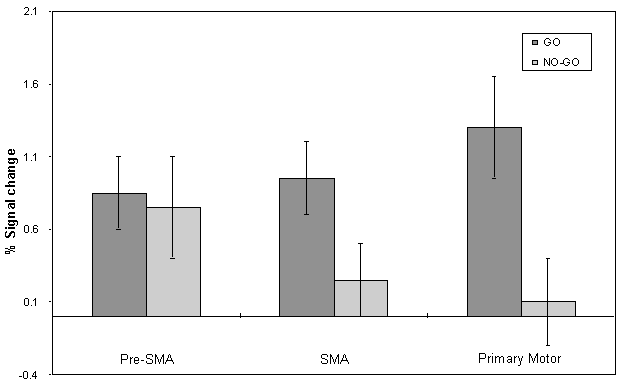
For each subject the point in the time course of maximal activation in the rostral and caudal medial premotor cortex was identified, and the percentage changes in response to the 'go' and 'no-go' tasks from the rest state measured. Similarly the points of maximal activity during the 'go' and the 'no-go' task were identified in the primary motor cortex. Paired t-test comparisons between the 'go' and 'no-go' percentage changes were performed across subjects for these regions of maximum activity.
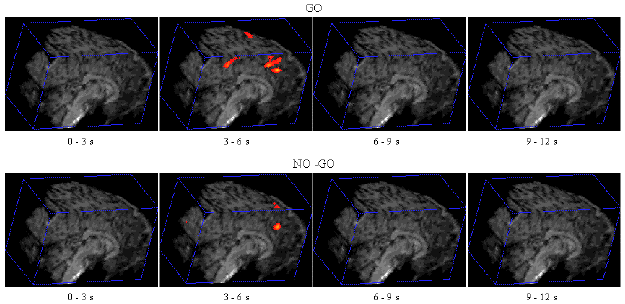
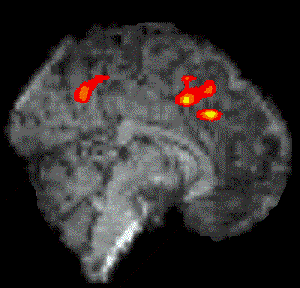
Figure 7.7 shows the activation at 0 s, 3 s, 6 s and 9 s following the stimulus, for one subject in the 'go, no-go' experiment. Maximum activation occurs at 3-6 seconds from the delivery of the stimulus. During the 'no-go' task, activation was seen in the medial premotor cortex for all the subjects. This region was rostral to the anterior commissural (AC) line. Activity was observed in these regions during the 'go' task as well (see Figure 7.8). During the 'go' task activation was also seen in a region of the premotor cortex caudal to the AC line.

 |
 |
| Go | No-Go |
The mean value of the percentage change upon activation of the areas involved in the motor task are shown in Figure 7.9. This shows the rostral part of the premotor cortex (labelled pre-SMA) to be active in both 'go' and 'no-go' tasks, with the caudal part (labelled SMA) being only active in the 'go' task. This suggests that the pre-SMA is involved in the movement decision making aspect of the task, whereas the SMA proper is more intimately involved in the movement itself.

The results presented illustrate that the imaging of single events is possible. As was mentioned earlier, such a study of movement decision making would be difficult to carry out using a traditional epoch based paradigm. From the electrophysiological measurements of such tasks, it is clear that the neural activity only lasts a few hundred milliseconds, however such short neural events can be detected using fMRI. This is important since many other interesting cognitive paradigms do not adapt easily to providing periods of sustained activity. Since similar techniques of stimulus presentation are used in brain studies using evoked potentials, the same experiments can be used with both modalities.
Single event paradigms require longer experiments than their epoch based counterparts, in order that the required signal to noise ratio is achieved. A delay of at least 10 seconds is required between each stimulus to enable the blood flow changes to return to the baseline.
[1] Passingham, R. (1993) 'The Frontal Lobes and Voluntary Action'. Oxford University Press.
[2] Matsuzaka, Y., Aizawa, H. and Tanji, J. (1992) A Motor Area Rostral to the Supplementary Motor Area (Presupplementary Motor Area) in the Monkey: Neuronal Activity During a Learned Motor Task. J. Neurophysiol. 68,653-662.
[3] Humberstone, M., Sawle, G. V., Clare, S., Hykin, J., Coxon, R., Bowtell, R., Macdonald, I. A. and Morris, P. (1997) Functional MRI of Single Motor Events Annals of Neurology In Press.
[4] Lab PC+, National Instruments Corporation.
[5] Turbo C++, Borland.
[6] Rohrbaugh, J. W., Parasuraman, R. and Johnson, R. (1990) 'Event-Related Brain Potentials', Oxford University Press.
[7] Leimkuhler, M. E. and Mesulam, M. M. (1985) Reversible Go-No go Deficits in a Case of Frontal Lobe Tumour. Ann. Neurol. 18,617-619.
[8] Mansfield, P., Coxon, R. and Glover, P. (1994) Echo-Planar Imaging of the Brain at 3.0 T: First Normal Volunteer Results. J. Comput. Assist. Tomogr. 18,339-343.
[9] Peters, A. M., Mansfield, P. and Bowtell, R. (1996) A short head gradient set for EPI at high magnetic field. in Book of Abstracts, 13th Annual Meeting European Society of Magnetic Resonance in Medicine and Biology. Abstract 138.
[10] Glover, P. (1993) High Field Magnetic Resonance Imaging. PhD Thesis, University of Nottingham.